Civic (CVC) Price Prediction 2026–2030: Can CVC Hit $1 Soon?
What to Know
- Civic gained 2.59% to $0.02373, reflecting improving buying activity as the cryptocurrency attempts to recover from October’s prolonged price decline.
- CVC’s RSI reached 47.21, indicating recovering momentum, while Bollinger Bands suggest buyers are challenging resistance following recent market weakness.
- Maintaining support above $0.02156 could strengthen recovery prospects, while sustained buying demand may support higher valuations through 2030 price projections.
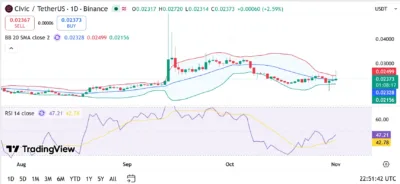
Civic (CVC) trades near $0.02373, recording a 2.59% daily increase as buyers attempt to establish recovery momentum following October’s prolonged correction. According to the TradingView daily chart, CVC has moved above its 20-day Bollinger Band average of $0.02328, suggesting improving short-term buying activity.
The latest candle opened at $0.02317, reached $0.02720, and recorded a low of $0.02314. Meanwhile, the Relative Strength Index (RSI) stands at 47.21, above its moving average of 42.78, indicating strengthening momentum despite remaining below the neutral threshold.
Market Structure and Price Action
Civic experienced considerable volatility throughout August, initially trading around $0.018 before gradually recovering toward $0.020. Early selling pressure restricted appreciation, although buyers established a relatively stable price structure toward September.
September brought stronger buying activity, with CVC advancing above $0.022 before experiencing a significant price surge that briefly pushed the cryptocurrency beyond $0.040. Nevertheless, profit-taking triggered a correction, preventing sustained appreciation at elevated levels.
October recorded another recovery attempt as buyers pushed CVC toward $0.031–$0.033. However, resistance restricted further gains, resulting in successive bearish candles that eventually brought prices toward $0.022.
November opened with a 2.59% increase, lifting CVC toward $0.02373. Maintaining support above $0.02328 could allow buyers to challenge resistance at $0.02499, followed by $0.02720. Conversely, renewed selling could push prices below $0.02328, potentially exposing the lower Bollinger Band at $0.02156 and the psychological $0.020 support region.
Bollinger Bands Indicate Improving Recovery Prospects
CVC trades above its middle Bollinger Band at $0.02328, suggesting that short-term buying pressure is gradually strengthening following October’s correction. The lower band stands at $0.02156, providing an important potential support level.
Meanwhile, the upper Bollinger Band sits at $0.02499, representing immediate resistance as buyers attempt to extend the latest recovery. A sustained breakout above this boundary could strengthen bullish expectations, potentially allowing CVC to challenge $0.02720 and eventually $0.030.
Reaching $0.030 would require approximately 26.42% appreciation from $0.02373, while reaching $1 would demand approximately 4,114.08% growth. Nevertheless, achieving these higher valuations would require considerably stronger buying participation, improved liquidity, and sustained favorable cryptocurrency market conditions.
RSI Signals Recovering Momentum Amid Market Uncertainty
The RSI reading of 47.21 remains below the neutral threshold of 50, indicating that bullish momentum has not completely established dominance. Nevertheless, its position above the moving average of 42.78 suggests improving buying activity.
During October, the indicator weakened considerably alongside declining prices, approaching oversold territory before recovering toward November. This movement suggests that selling pressure may be easing as buyers gradually regain participation.
Maintaining an RSI above 45 could support price stabilization, while a sustained recovery beyond 50 would strengthen bullish expectations. Conversely, another decline beneath 40 could indicate renewed weakness and increase the likelihood of additional downside.
Source: TradingView
CVC Price Predictions (2026–2030)
| Year | Minimum Price | Average Price | Maximum Price |
|---|---|---|---|
| 2026 | $0.020 | $0.027 | $0.040 |
| 2027 | $0.018 | $0.045 | $0.080 |
| 2028 | $0.025 | $0.080 | $0.150 |
| 2029 | $0.040 | $0.150 | $0.300 |
| 2030 | $0.060 | $0.300 | $0.500 |
Yearly Insights
2026
CVC’s remaining 2026 outlook depends on defending $0.02156 and reclaiming $0.02499. Stronger buying could support an advance toward $0.040, while renewed selling might expose the psychological $0.020 support region.
2027
Improving cryptocurrency market conditions could support an advance toward $0.080 if demand strengthens and buying participation expands. Nevertheless, weaker market activity could restrict CVC toward the projected $0.018 minimum.
2028
Broader cryptocurrency market expansion and increased adoption of blockchain identity solutions could allow CVC to challenge $0.150, provided liquidity and investor participation improve. Unfavorable conditions could instead restrict prices near $0.025.
2029
Sustained buying demand and favorable cryptocurrency market conditions could support appreciation toward $0.300. Nevertheless, prolonged bearish pressure and insufficient investor participation could limit CVC closer to $0.040.
2030
A favorable long-term scenario places CVC near $0.500, provided adoption, liquidity, and market participation strengthen considerably. Reaching $1 would require a substantially larger rally beyond this projected maximum, making the milestone highly speculative without stronger fundamental growth.
Conclusion
Civic shows improving short-term momentum following its 2.59% recovery to $0.02373. Trading above the Bollinger Band midpoint of $0.02328 suggests strengthening buying activity, although resistance remains near $0.02499. Reclaiming this upper boundary could support an advance toward $0.02720, while losing $0.02156 could expose additional downside. The $1 target remains speculative and depends on sustained demand, wider adoption, and favorable cryptocurrency market conditions.
FAQs
1. What is the immediate support level for CVC?
Immediate support stands near $0.02328, followed by the lower Bollinger Band at $0.02156.
2. What is the next major resistance for CVC?
CVC faces resistance at $0.02499, followed by $0.02720 and the psychological $0.030 level.
3. What does CVC’s RSI indicate?
The RSI reading of 47.21 indicates recovering momentum, although bullish conditions remain unconfirmed below the neutral threshold of 50.
4. Can CVC reach $1 before 2030?
Reaching $1 would require approximately 4,114.08% appreciation from $0.02373, making the target mathematically possible but highly speculative.
5. Why is the Bollinger Band midline important?
The $0.02328 midline represents the 20-day moving average, serving as potential support during recovery attempts and helping identify changes in short-term market momentum.
This story was originally published by 36Crypto. Read the original article.