XRP Price Rebounds From $1.20 Into a Wall of Broken Support

Key Takeaways
- XRP lost its 100- and 200-day averages.
- Buyers defended $1.20 after a liquidity sweep.
- Broken support now caps price near $1.27.
- A close above $1.3012 would change the picture.
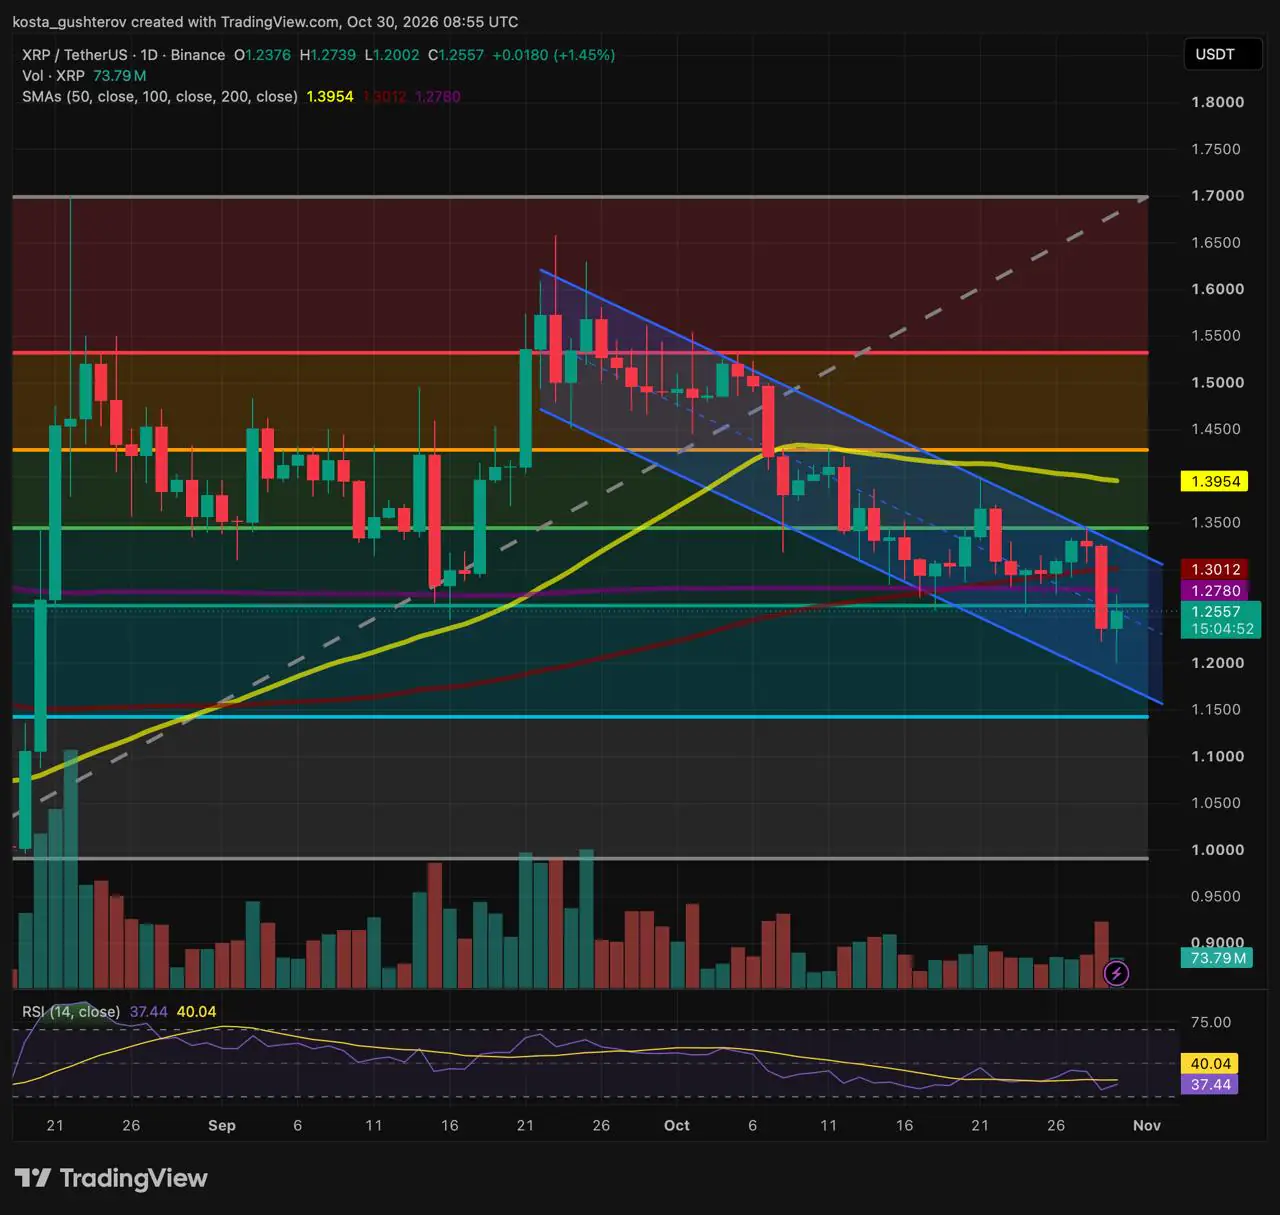
XRP traded at $1.25 at 08:55 UTC on Friday (October 30,2026) up 1.45% on the day, according to the Binance XRP/USDT daily chart.
Anatomy of today’s candle
High $1.27
under 200-day SMA
Last $1.25
+1.45% on the day
Open $1.23
yesterday’s close
Low $1.20
overnight sweep
Drawn to scale · Volume 73.79M XRP · Candle still open at 08:55 UTC
Today’s candle opened at $1.237, right where yesterday’s breakdown candle closed. The drop to $1.20 came overnight, after news broke that Binance had suffered a $6.3 billion hack, the largest in crypto history. XRP flushed stops down to $1.20 before buyers stepped in hard. The rebound carried price up to test the underside of the 0.618 Fibonacci level, the golden pocket, near $1.26, and to an intraday high of $1.27.
What changed yesterday
The bounce follows a sharp breakdown. After a multi-day relief attempt was capped at the upper boundary of the descending channel and the 0.500 Fibonacci level near $1.34, sellers forced a heavy expansion candle lower on Thursday. It cut through the golden pocket and both long-term averages, the 200-day SMA at $1.27 and the 100-day SMA at $1.30, as reports of Binance hack spread through the market in the evening.
XRP now trades below all three of its main moving averages, the 50-day at $1.39 included, which places it in a short-to-medium-term corrective structure.
That correction has a clear shape. Since the $1.70 August peak, price has moved inside a descending parallel channel, shaded blue on the chart. Every rally since late September has been rejected at the upper trendline, while sell-offs have run out of steam near the lower one. Today’s flush to $1.20 tagged the lower half of the channel, which set up the current mean-reversion bounce.
Support that turned into a ceiling
↑ Floor in early October
↓ Ceiling today
golden pocket · 200-day SMA · 100-day SMA
The three levels that held XRP up earlier this month now sit above it as one dense supply zone. The first retest has already met sellers: today’s high of $1.27 stalled just shy of the 200-day SMA at $1.27, a sign they are defending the broken averages.
The long lower wick off $1.20 shows real bids resting near the channel’s lower boundary, but it doesn’t undo the damage from losing the 100- and 200-day averages. XRP is now testing the broken golden pocket and 200-day from below, a support-to-resistance flip. Unless buyers force a daily close above $1.30 to reclaim the moving-average cluster and break the channel ceiling, the bounce reads as a relief test. Below it, the 0.786 Fibonacci level at $1.14 is the next demand zone.
The RSI points the same way. The 14-day reading stands at 37.44, below its 40.04 signal line and well under the 50 midline. It has hooked up slightly with today’s buying, but there is no bullish crossover or divergence yet, so sellers still control the higher-timeframe trend.
Reading the chart’s colored lines
The Fibonacci grid runs from the $0.99 August base (the 1.0 level) to the $1.70 peak (the 0 level). Each color below matches a line on the chart.
$1.70 · cycle peak, the 0 Fib where the broader correction began $1.53 · breakdown origin, the 0.236 Fib and upper structural supply $1.42 · 0.382 Fib, part of the trend ceiling with the yellow 50-day SMA at $1.39 $1.34 · 0.500 Fib, alongside the channel’s upper trendline near $1.32 $1.26 · 0.618 golden pocket, now capped with the purple 200-day ($1.27) and red 100-day ($1.30) $1.20 · today’s sweep low and the $1.20 round number $1.14 · 0.786 Fib, near the channel’s lower boundary $0.99 – $1.0000 · cycle base, the 1.0 Fib where the late-summer breakout started
Where does XRP close?
Neither branch is a call; each depends on where the daily candle settles.
XRP at $1.25
↓
If it closes under $1.26-$1.27
Today’s green move turns into a retest of broken support. Sellers return in the $1.26-$1.27 band and push price back toward the $1.20 low.
A break below $1.20 would open a slide toward the 0.786 Fib at $1.1426, where the channel’s lower trendline currently sits. This branch stays live while XRP trades below $1.30.
If it closes above $1.30
Buyers build on today’s 73.79M XRP of volume and reclaim both the 200-day and 100-day SMAs, turning yesterday’s breakdown into a bear trap.
That could squeeze late shorts and bring a test of the channel ceiling and 0.500 Fib at $1.32–$1.34. Only a breakout above that ceiling would open a broader recovery toward the 50-day SMA at $1.39.
Zooming out
Even the lower branch would leave XRP well above the $0.99-$1.0000 base that launched its late-summer breakout, so the move from August is still intact. Repairing the trend is a taller order: that only starts once XRP is back above its 50-day SMA.
This story was originally published by Coindoo. Read the original article.