XRP Price Near Major Support – Weekly Chart Analysis

Key Takeaways
- 200-week SMA at $1.28, price near $1.05.
- November monthly candle down 15% so far.
- 0.786 near $0.87, 100-month SMA at $0.84.
- Below the 200-week from June 1 to August 17.
Coindoo’s daily analysis on Tuesday had XRP four cents from the $0.99 base of its August rally; this analysis steps back two timeframes to see what sits underneath that base.
The channel inside the channel
The descending channel XRP fell out recently is a six-week structure. Zoom out to the weekly chart and it sits inside a much larger one, a descending channel drawn from the 2025 high that has contained every rally attempt since. The daily breakdown is a move within that bigger channel, not out of it.
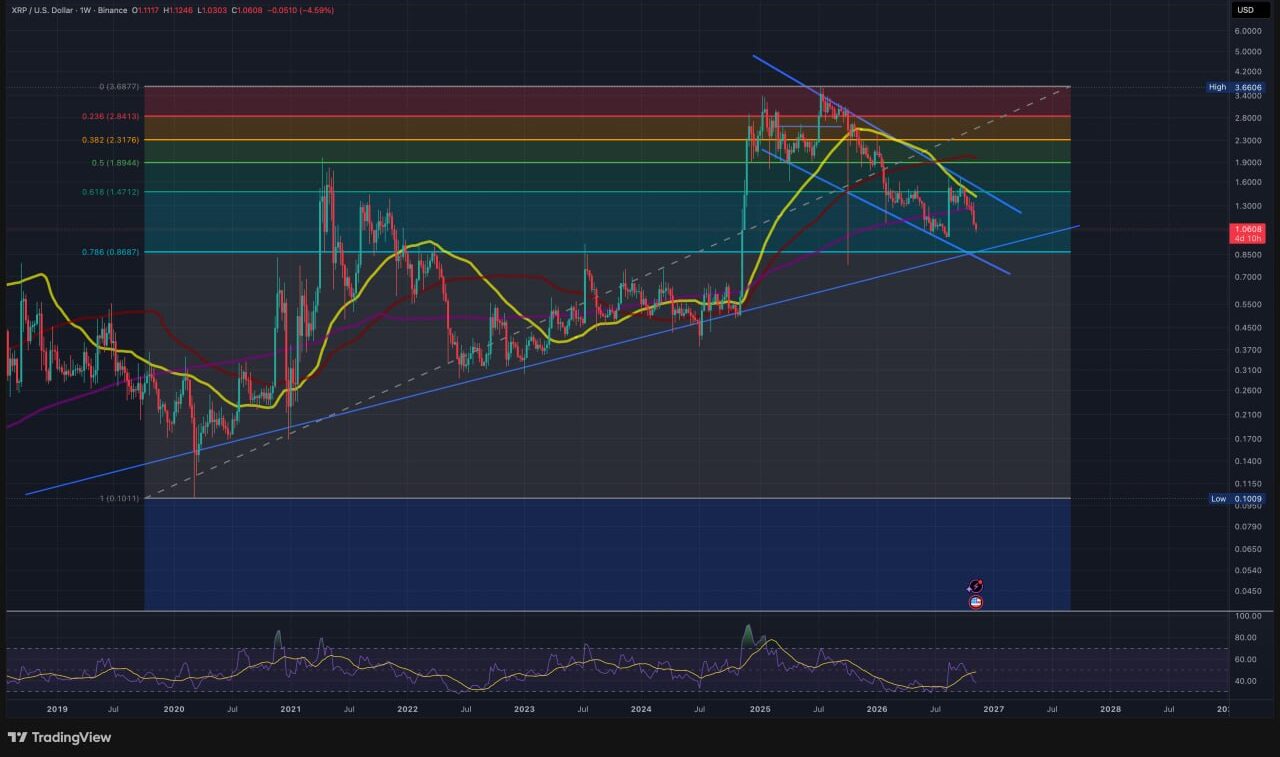
What did change on the weekly timeframe is the 200-week simple moving average at $1.28. XRP spent June 1 to August 17 below it, and the August rally that started at $0.99 was the move that took price back above. That reclaim lasted less than three months. Price is now about 21% under the line, with the 50-week SMA at $1.41 and the 100-week at $1.96 stacked above it; the furthest of the three is close to double the current price.
The second loss reads differently from the first. In June, XRP dipped under a rising average and climbed back in about eleven weeks. This time it reclaimed the line, failed to hold it, and fell through again. A dip below support and a failed reclaim of it are not the same signal, and the second is the one that opens the question of where the next floor is.
This week’s candle, with three days still to run, opened at $1.11, has a high of $1.12 and a low of $1.03.
Which floor each chart is watching, from $1.06
Daily$0.99, the 1.0 Fib of the August rally−6.6% Weekly$0.87 to $0.90, where four weekly and monthly supports meet−15% to −18% Monthly$0.84, the lowest of the four−21%
One thing to keep in mind when reading these two charts: the retracement levels on them are drawn from the 2020 low near $0.10 up to the 2025 high near $3.69, so they are spread out in a way the daily grid never is. The 0.618 sits near $1.47, the 0.5 near $1.89, the 0.382 near $2.32 and the 0.236 all the way up near $2.84. Tuesday’s daily levels measured a rally that lasted three months. These measure six years. That is really why the two charts don’t agree on where support is. Lose $0.99 and XRP gives back one rally. Lose the weekly levels and it gives back most of a cycle.
Four lines, one price
The $0.90 area is where the higher-timeframe supports pile up, four of them inside six cents.
The $0.84 to $0.90 confluence
near $0.90Lower rail of the weekly channel from the 2025 high near $0.90Rising support line from the 2020–2021 lows, which has caught the cycle’s lows so far near $0.870.786 retracement, $0.10 low to $3.69 high $0.84100-month simple moving average
Four independent reasons for buyers to show up in a six-cent band are unusual, and they are why this zone might have the power to settle whether the 2025 to 2026 decline is a correction inside a longer uptrend or the end of it. The $0.99 level is where a three-month rally started. The $0.87 level is where a six-year rally would have given back more than three quarters of its gains. One is a floor for traders; the other is a floor for the trend. None of this means the band holds; it means the band is where the question could get answered.
What the monthly candle adds
November’s monthly candle opened at $1.25, reached $1.34 and has traded as low as $1.03, a drop of 15% with 18 days still to run. The 50-month SMA at $1.20 sits inside that range: price started the month above it and is now below it. The 0.618 near $1.47, the next retracement level overhead, is almost 40% away.
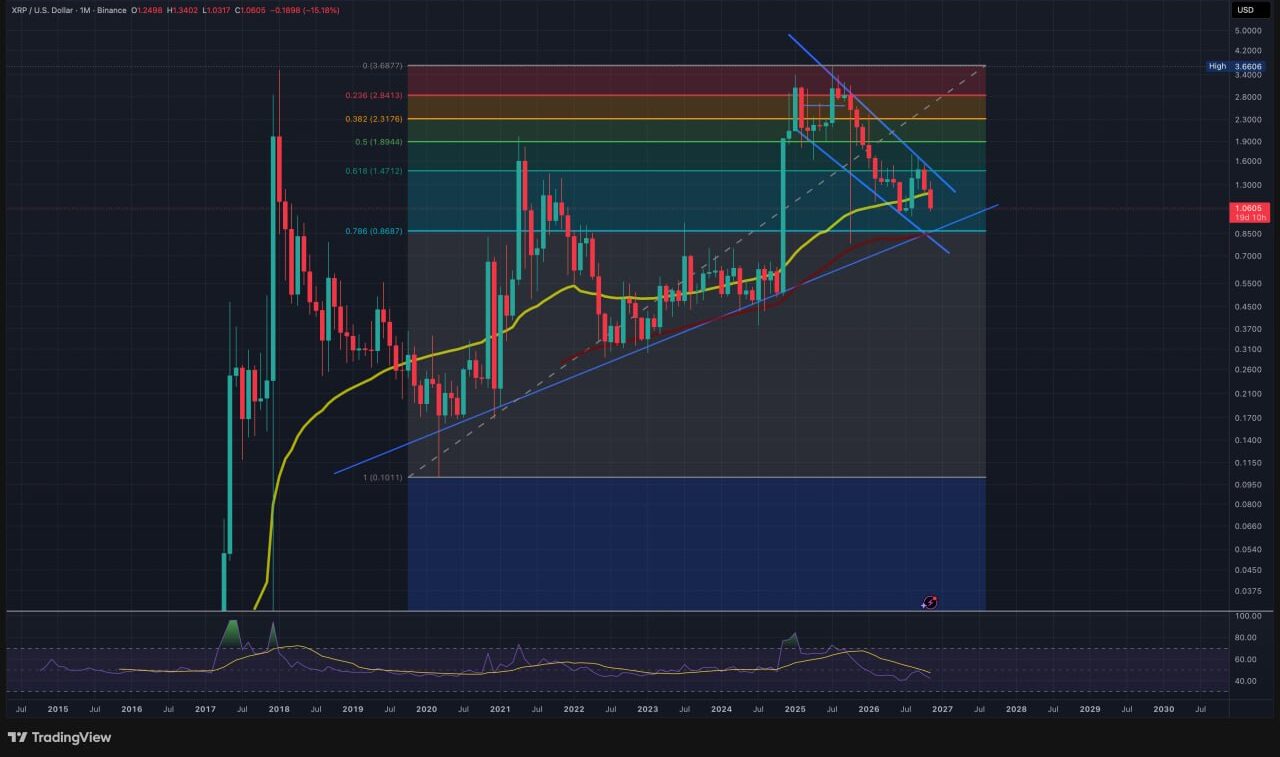
A monthly candle this far from finished is a warning against reading too much into it. The wick to $1.03 is a fact; where November closes is not yet. The levels on this chart are drawn from monthly closes, so the cycle trendline and the 100-month SMA are only tested in the sense that matters when the candle closes on or beneath them. An intraday dip to $0.90 in the next 18 days would count as a test; only a monthly close under $0.84 would count as a break.
Why a daily bounce doesn’t settle it
The daily chart gives XRP a reason for a possible bounce: an oversold RSI at a level where its August rally began. That case is weaker while the whole market is still falling. In the past 48 hours Bitcoin dropped under $74,000 after the inflation report and Ethereum lost its 200-day average, and an oversold reading on one coin carries less weight when the selling is everywhere at once.
Even if a bounce arrives, a move from $0.99 that stops under $1.28 would leave the weekly chart exactly as it is, with price below all three weekly averages and inside the descending channel. It would be a recovery inside a downtrend, which is the same shape as the derivatives picture Coindoo described on November 11, where one exchange’s open interest reset did not amount to a market-wide one. A partial reset in positioning and a partial recovery in price can both be real without either ending the selloff.
The weekly structure could only start to change with a weekly close back above the 200-week at $1.28. Before that, the 50-month SMA at $1.20 is the first higher-timeframe level a rebound would meet.
Two ways the next weeks could run
Both paths run through the same band; what differs is whether $0.84 to $0.90 ends up as the floor or the exit.
Down into the zone
If the daily $0.99 level gives way, the next area the weekly chart points to is the top of the confluence band near $0.90, about 15% below the current price, with the 0.786 near $0.87 and the 100-month SMA at $0.84 a few cents further. This is the area where the channel floor, the cycle trendline and the long-term average could all prompt a reaction. The size of any bounce from there would be measured first against $0.99, then $1.20, then the 200-week.
Through the zone
A weekly close under $0.84 would leave XRP beneath every moving average and every trendline on both charts. The Fibonacci grid offers nothing between there and the 2020 low near $0.10; the next reference points would have to come from the ranges XRP traded before the November 2024 breakout, which these charts do not mark.
Two closes, in order
Sunday’s weekly close comes first. With the 200-week a fifth of the way up, it is unlikely to repair the weekly structure; what it can show is whether $1.03 survives the week and how far above it the candle finishes. The monthly close on November 30 is the one with the big levels on it: the 50-month SMA at $1.20 above, the 100-month at $0.84 below, and the cycle trendline in between. Until that candle prints, the weekly and monthly charts can only say where the test is. They cannot say it has passed.
This story was originally published by Coindoo. Read the original article.