XRP Price Hits the Same Wall 4 Days in a Row: Key Levels
Key Takeaways
- Resistance stack runs from near $1.26 to $1.31.
- 100-day SMA rose from $1.30 to $1.31.
- RSI 37.88, 2.42 points under signal line.
- Coinbase premium near -0.16%, lowest in eight months.
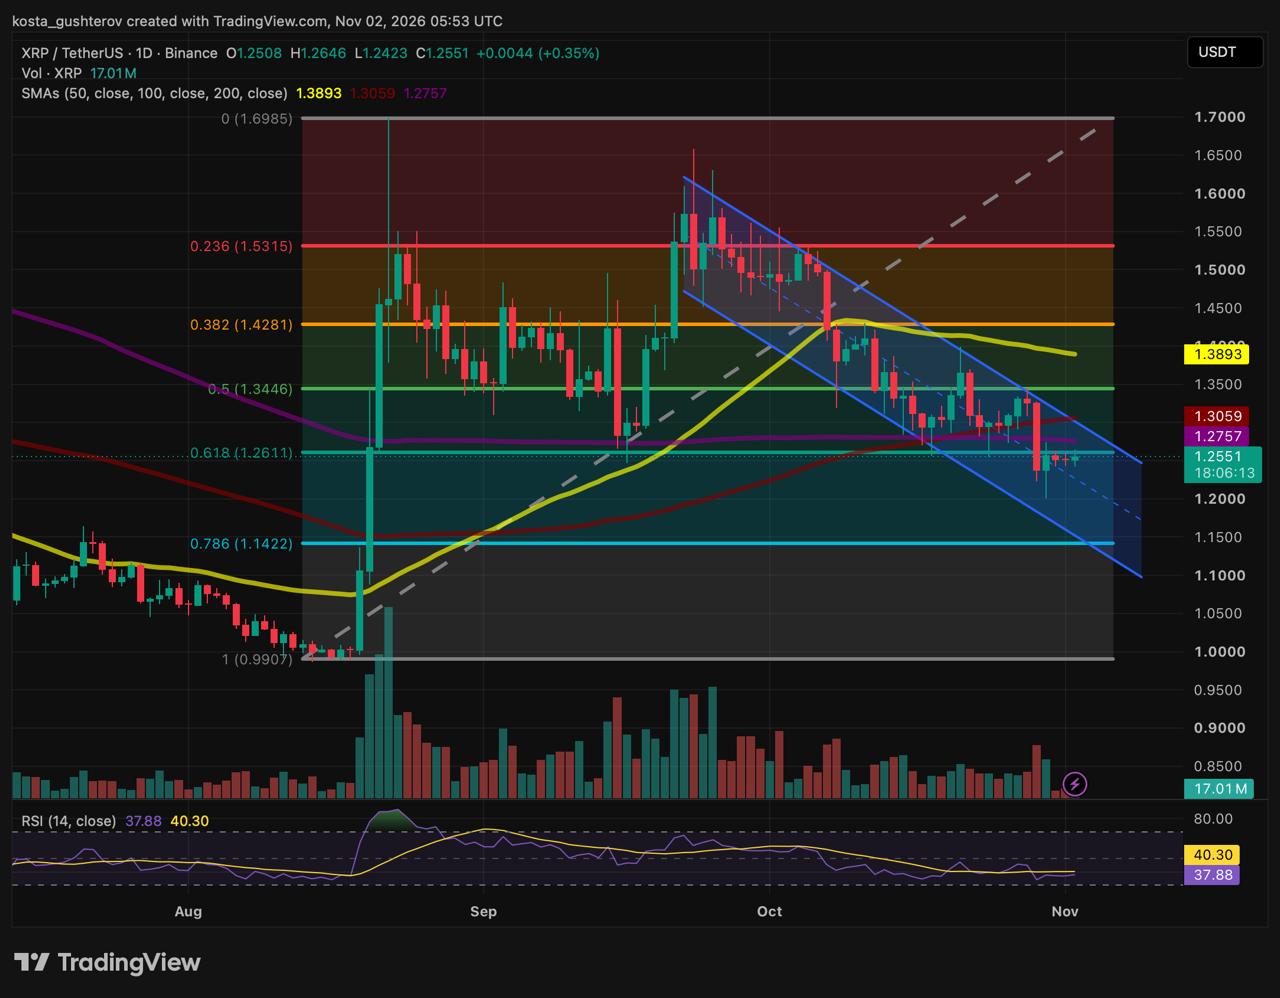
XRP traded just above $1.25 on Monday (November 2, 2026), up 0.35% on the day, according to the Binance XRP/USDT daily chart.
No close above the golden pocket since Friday
Friday’s bounce from $1.20 into broken support has not produced a single daily close above the 0.618 Fibonacci level near $1.26. Friday, Saturday and Sunday all settled under it, and Monday’s price action remains below it after briefly trading above it intraday. With the day’s low at $1.24, XRP is moving sideways in a band around $1.25.
The sideways trade has come on lighter volume than Friday’s sweep session. Monday’s candle had logged 17.01M XRP by 05:53 UTC, while Friday’s candle had already reached 73.79M XRP by 08:55 UTC, three hours further into its session. Saturday’s and Sunday’s volume bars are also shorter than Friday’s.
A resistance stack under 5 cents deep
Above price, resistance has bunched into a band less than 5 cents wide, roughly 3.5% from bottom to top. It holds four barriers: the golden pocket near $1.26, the purple 200-day SMA at $1.28, the red 100-day SMA at $1.31, and the upper boundary of the descending channel, which has kept falling and now runs alongside the 100-day around $1.30. On Friday, breaking the channel still meant clearing levels closer to $1.32.
XRP has hugged the underside of that former support for four sessions without a meaningful bounce, a sign buyers have not stepped in with any force. Price is sitting on a bearish ledge, a narrow shelf just under broken support, and a loss of the floor beneath it would open a continuation leg toward the 0.786 Fibonacci level around $1.14.
The falling channel ceiling has also shortened the distance bulls need to cover. A daily close above $1.31 would reclaim both long-term averages and push price through the channel in a single move, with the 200-day as the first hurdle on the way. Until that close prints, every push into the stack remains a support-to-resistance retest inside a downtrend.
XRP level map
Fibonacci grid from the August low near $0.99 to the August high near $1.70 · distance measured from Monday’s 05:53 UTC price
near $1.700 Fib · August cycle peak, where the correction began+35% near $1.530.236 Fib · early-October breakdown shelf+22% $1.39 – near $1.4350-day SMA + 0.382 Fib · major trend ceiling and macro supply zone+11% to +14% near $1.340.500 Fib · late-October swing-high rejection+7.1% $1.31100-day SMA · upper average hurdle, channel ceiling alongside · up from $1.30 on Friday+4.0% $1.28200-day SMA · first hurdle inside the stack · edging lower since Friday+1.6% near $1.260.618 golden pocket · immediate ceiling, former mid-October floor+0.5% $1.24Monday’s low · bottom of the active compression band-1.0% $1.20Friday’s sweep low · liquidity floor and round-number support-4.4% near $1.140.786 Fib · next Fibonacci target, close to the channel’s lower boundary-9.0% near $0.99 – $1.001.0 Fib · base of the August rally-20% to -21%
The 50-day is closing in on the 100-day
Since Friday, the 100-day SMA has edged higher while the 200-day has slipped, so the top of the stack has risen slightly even as the channel ceiling fell to meet it. Above the stack, the yellow 50-day SMA, which peaked near $1.43 in early October, is still sliding and sits at $1.39, about 8 cents over the rising 100-day. The two have not crossed, but the gap between them is shrinking. For as long as XRP trades under the 200-day at $1.28, all three averages sit overhead as reference points for sellers.
The 14-day RSI has flattened at 37.88, barely above Friday’s 37.44, and remains 2.42 points under its 40.30 signal line and below the 50 midline. A cross above the signal line would be the first evidence that momentum is turning. Until then, the indicator sides with the sellers.
Coinbase is pricing XRP below Binance
CryptoQuant data adds a view from across exchanges. In a post on CryptoQuant published on November 2, contributor Arab Chain reported that XRP’s Coinbase Premium Index had fallen to roughly -0.16%, an eight-month low.
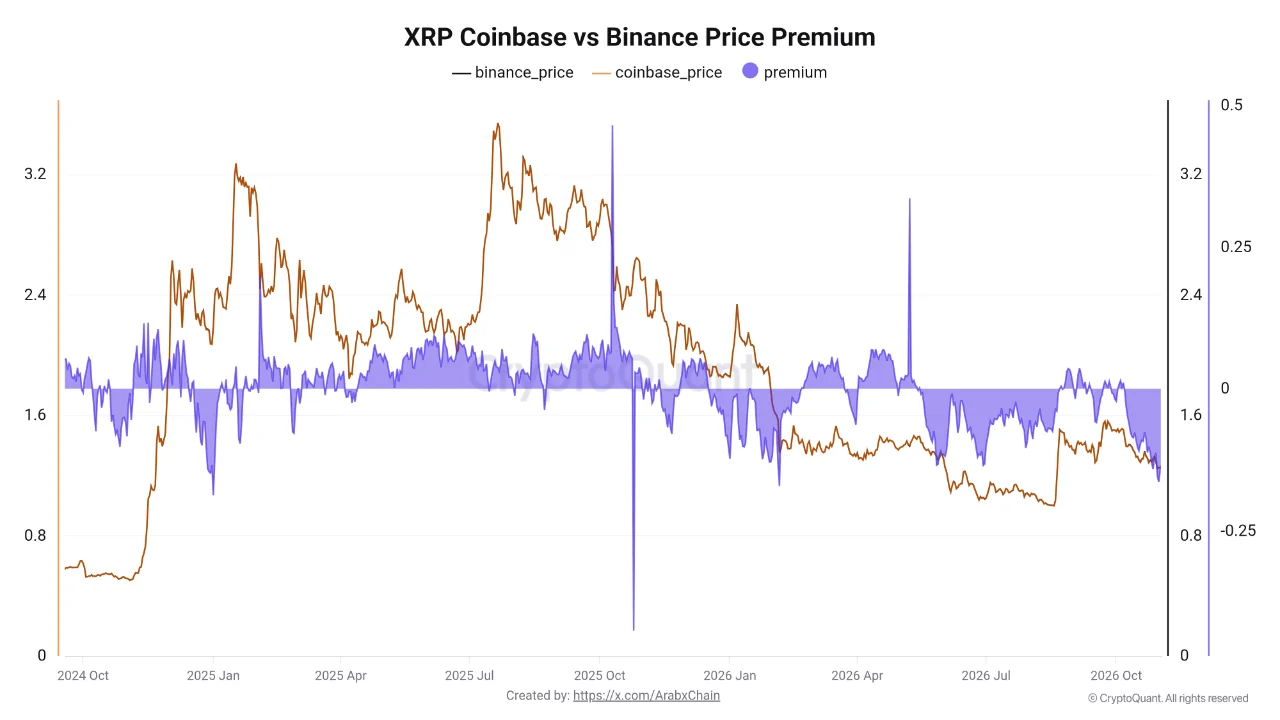
The index compares XRP’s price on Coinbase with its price on Binance, and a negative value means the token is changing hands more cheaply on Coinbase. Arab Chain reads that as weaker demand on Coinbase relative to Binance, a gap that matters most for the US market, where Coinbase has a large institutional and retail presence.
Arab Chain’s chart shows the index below zero for most of the period since mid-2026, apart from a brief positive stretch around September. According to the contributor, sustained negative readings have historically lined up with weaker buying on Coinbase, while a return above zero may point to improving demand. Arab Chain also cautioned that the decline “should not be considered definitive evidence of continued downside pressure,” and recommended reading it alongside volume, exchange flows and price.
If the reading reflects genuine demand, it matches the chart. Clearing a stack this dense takes spot buyers willing to pay up, and the premium would place US traders on the less eager side while XRP kept closing under the golden pocket.
Binance Hack Prompts Unaffected Firm to Weigh Bitcoin Sale
The Binance freeze clouds the reading
The premium’s slide overlapped with Binance’s withdrawal suspension. Binance halted withdrawals after the October 29 hack but kept deposits open, so traders could send XRP into the exchange but not take it back out. Closing a gap where Binance trades above Coinbase normally means buying on Coinbase, depositing on Binance and selling there. During the freeze, anyone running that trade would have left funds stranded on an exchange that had just lost $6.3 billion. Part of the discount could reflect that one-way arbitrage rather than a pullback in US demand.
The timing of the low itself is less clear-cut. XRP was among the first assets Binance reopened for withdrawals on November 1, according to its recovery update, and Arab Chain’s post came a day later, so the latest readings may span both sides of the reopening. The coming week of data, taken with arbitrage fully open, should separate the two explanations. A move back toward zero would favor the freeze, while a discount that holds near -0.16% or deepens would strengthen the weak-demand case and put more pressure on the $1.24 floor.
Two ways out of the range
Confirmation for either path is a daily close, which makes the next few sessions the window to watch.
Sellers keep the lid on
Trigger: daily closes stay under the golden pocket and the 200-day SMA, and Monday’s $1.24 low gives way.
Path: losing $1.24 would expose a retest of the $1.20 sweep low. If $1.20 breaks on expanding sell volume, the channel points toward the 0.786 level close to $1.14, roughly 9% below the current price.
Buyers clear the stack
Trigger: buyers absorb supply at the golden pocket, the RSI crosses above its 40.30 signal line, and a daily candle closes above the 100-day SMA at $1.31.
Path: that close would also clear the 200-day and the channel ceiling, undoing the golden-pocket breakdown. It could spark a short-covering move toward the 0.500 level around $1.34 and the 50-day SMA at $1.39.
What neither path erases: even a slide to the 0.786 level near $1.14 would leave XRP more than 14% above the 1.0 Fibonacci base near $0.99–$1.00, where the August rally started. A break above $1.31, for its part, would repair the channel without reaching the major trend ceiling higher up.
This story was originally published by Coindoo. Read the original article.