Solana Price Loses the 200-Day for First Time Since August

Key Takeaways
- First daily close under the 200-day since August.
- Today’s rebound stalled 60 cents below it.
- The low stopped 42 cents above the 0.618.
- RSI still sits above its October 30 low.
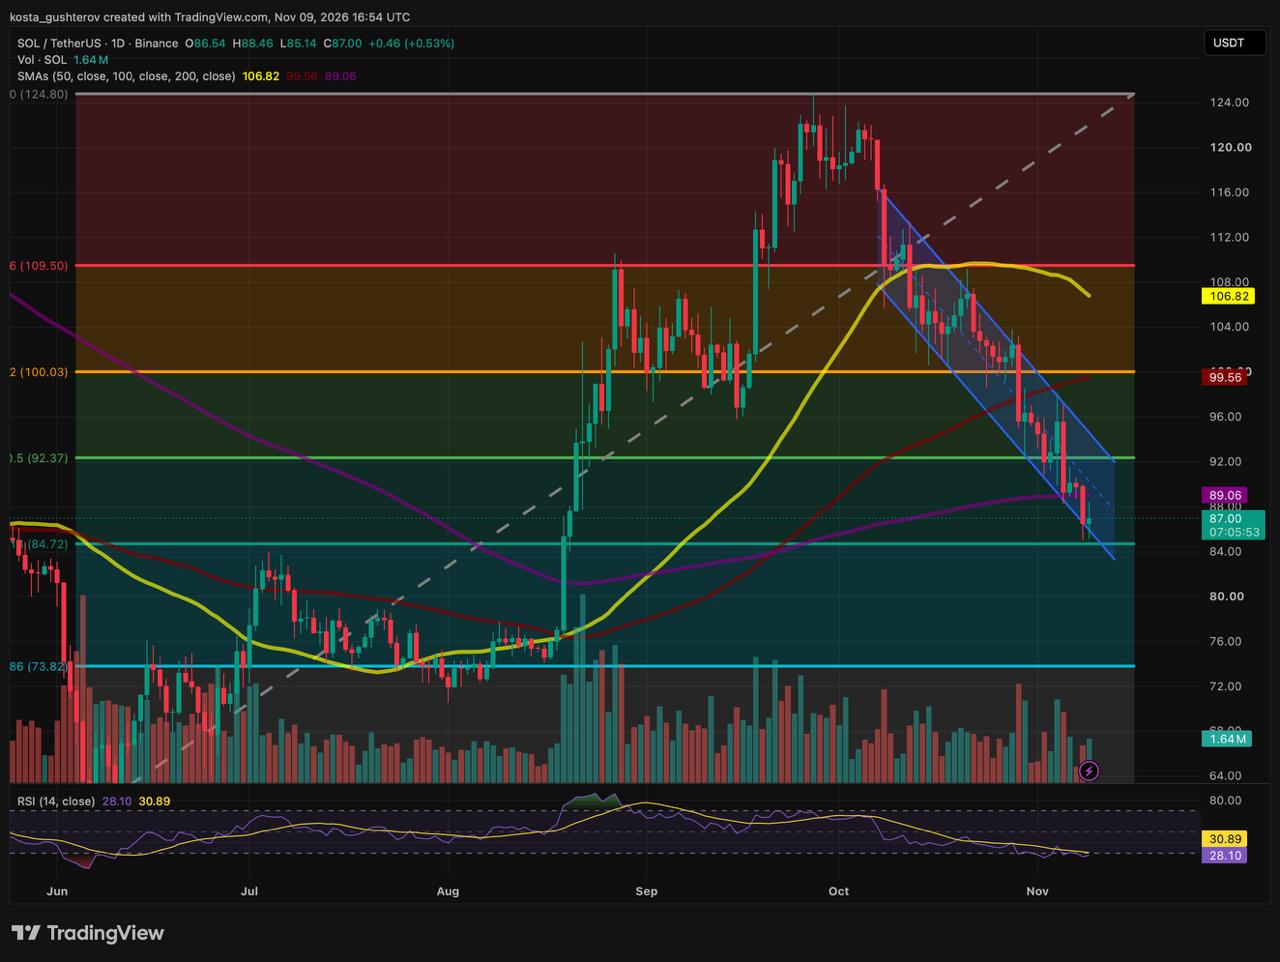
Coindoo’s November 6 analysis warned that the $89 support had a short shelf life: the 200-day SMA there was edging higher while the channel floor beneath it kept sinking. On the Binance daily chart at 16:54 UTC on November 9, SOL trades at $87, up 0.53% on the day.
The warning played out. The rail slid away, the 200-day was left without backup, and the November 8 candle went through it. Now the same setup is forming one level lower, where the falling rail is closing in on the 0.618 retracement near $84.7.
How the $89 base gave way
The November 6 bounce from $88.94 never got far. It topped out near $91, short of the 0.500 retracement near $92.37, and SOL drifted back toward $89 over the next session while the channel’s lower rail sank to around $87 underneath it.
On November 8, a full red candle opened near the 200-day SMA and closed at $86.54. It was SOL’s first daily close below the average since the August breakout, and it landed right around the channel floor.
The 200-day turns into a ceiling
Today’s session opened at $86.54 and bounced to $88.46, 60 cents under the 200-day at $89, before sellers turned it back. The drop that followed pushed through the channel’s lower rail to $85.14, 42 cents above the 0.618, and SOL has since recovered to $87.00. About 1.64 million SOL had traded with seven hours of the session left, a faster pace than November 6, which had logged roughly 743,000 SOL at its halfway point.
The 200-day had served as a floor since August. On its first retest from below, buyers could not even reach it.
The same clock, one floor lower
The lower rail falls by roughly 77 cents a day, and on its current slope it would cross the 0.618 near $84.7 around November 11. For a session or two, a falling channel floor and a horizontal Fibonacci level would share the same price, as the rail and the 200-day did at $89. After that, the rail would slip below the 0.618 and the overlap would end.
The 0.618 capped July and August trading until the August breakout, and SOL has not traded below it since.
Where the channel’s lower rail sits
Approximate, read from the daily chart
Nov 6about $89met the 200-day Nov 8about $87200-day left alone Nov 9about $86pierced intraday Nov 11, on current slopeabout $85meets the 0.618
Momentum still has a thin divergence
The 14-day RSI has dropped to 28.10, below the 30 oversold line and under its signal line at 30.89. It never crossed back over the signal during the November 6-7 pause.
The October 30 low, set the day after the record Binance hack, is still the momentum reference. Today’s low sits more than $7 under that day’s low, yet the RSI is 0.55 points above that day’s reading, so a bullish divergence survives for now. A close that drags the RSI under 27.55 would erase it.
Three recent swing lows
October 30Low $92.34RSI 27.55 November 6Low $88.94RSI 31.29 November 9Low $85.14RSI 28.10
The case for a bounce, and its ceiling
The bearish read has a weak spot. Price has met the 0.618 for the first time since August with an oversold RSI that still holds a divergence, and the channel floor is arriving at the same level within days. Those three together give buyers a defined place to make a stand.
Any rebound would still have to climb through a crowded stretch. The 200-day at $89, the 0.500 near $92.37 and the channel’s upper rail, now near $95, are stacked above price. Beyond them, the rising 100-day SMA at $99.56 sits beside the 0.382 near $100.03 and the $100 mark, and the 50-day, down to $106.82, is still falling toward the 0.236 near $109.50 from above.
The two closes that matter
SOL sits about $2 under the 200-day and about $2.3 above the 0.618.
Above $89
If SOL holds the 0.618 and the rail while the RSI stays above 27.55, a daily close back over the 200-day would undo the November 8 break. The 0.500 near $92.37 and the upper rail near $95 come next, and a move out of the channel could reopen the 100-day at $99.56 and the $100 area.
Below $84.7
A daily close under the 0.618 and the rail, with the RSI slipping below 27.55, would remove the last horizontal shelf from the August breakout. That could expose the $77 area where SOL traded in August and the 0.786 near $73.8, about 15% below the current price, with the June low of $59.9 beneath it.
The next few daily closes test whether the overlap near $85 lasts longer than the one at $89 did. Even a full climb back to the upper rail would leave SOL under both its 100-day and 50-day averages, with the September peak of $124.8 far above.
This story was originally published by Coindoo. Read the original article.