POL Price Rebounds 4% Off September Floor Near $0.09

Key Takeaways
- Intraday low $0.089 sat below 200-day SMA.
- 100-day SMA at $0.095 retaken intraday.
- RSI at 51.94 versus 41.53 signal line.
- Overhead band spans $0.098 to $0.101.
The levels below come from the POL/USDT daily chart on TradingView, using Binance prices as of 13:46 UTC on November 4. At that point POL traded at $0.096, up 4.19% or about $0.004, with roughly ten hours left in the daily candle.
From $0.089 to $0.097 in One Session
The session opened at $0.092 and fell to $0.089, slightly beneath the 200-day simple moving average at $0.090 and below the 0.618 Fibonacci retracement near $0.091. From there POL climbed through the 100-day SMA at $0.095, a line it had struggled to hold in late October, and reached $0.097.
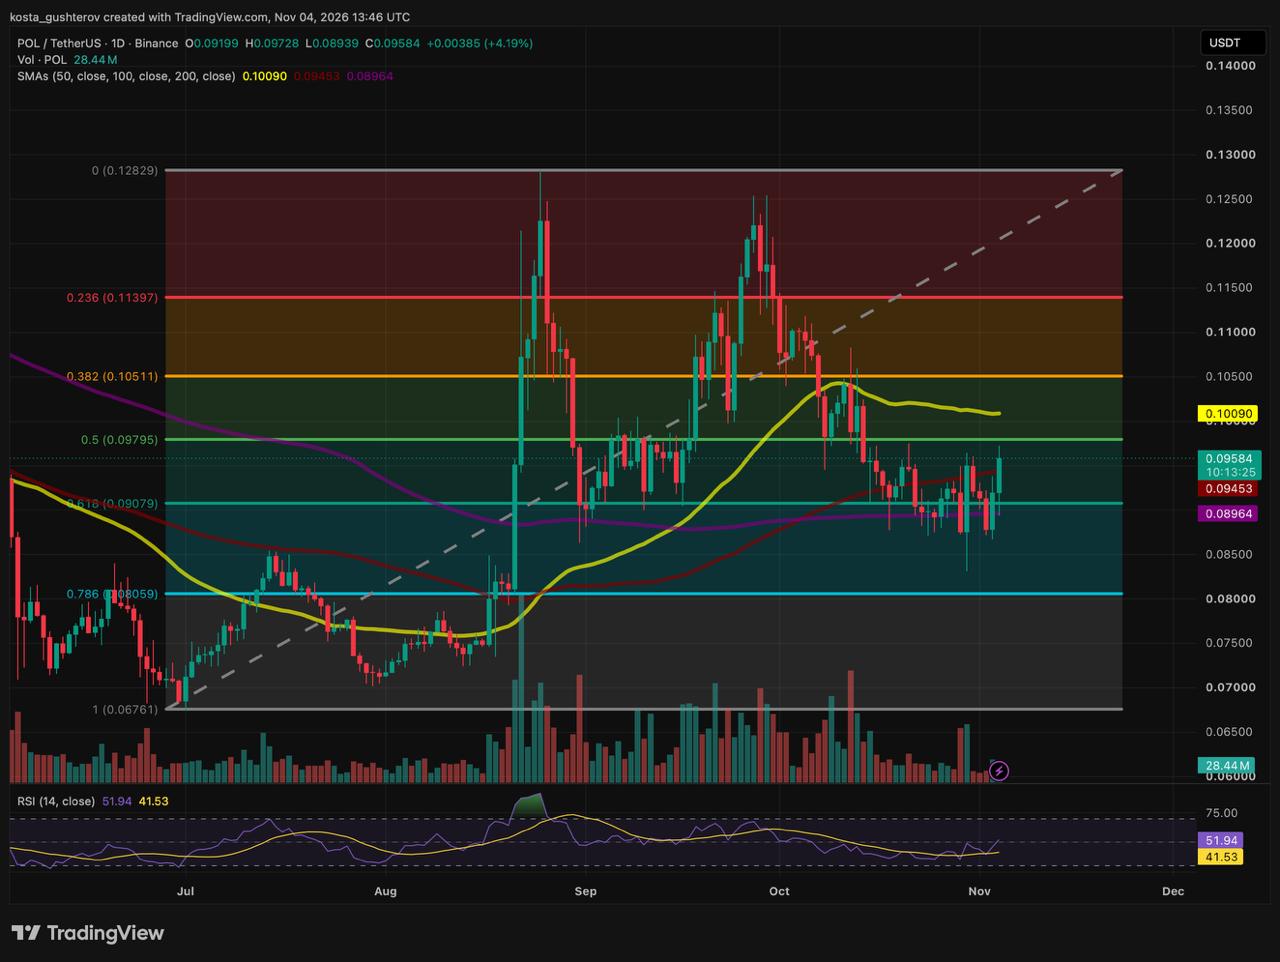
The high stopped about 0.68%, less than a tenth of a cent, short of the 0.500 retracement around $0.098. Because the candle is still open, the move above the 100-day SMA counts only as intraday. Holding $0.095 into the close would mark the past week’s trade below the 200-day SMA as a failed breakdown. Slipping back under it would reduce the session to a long lower wick.
The September Floor, Tested Again
On the Fibonacci grid drawn from the early-July low to the late-August peak, the 0.618 level near $0.091 held as support through early and mid-September, before POL climbed to a secondary peak above $0.123. The October decline has carried price back to the same area, with the 200-day SMA, flat since mid-September, running just underneath.
A second successful defence would mark $0.090 to $0.091 as the floor of a range dating back to September. Confirming it would take the next pullback ending without a daily close under $0.090.
The Shelf POL Lost in Mid-October
Overhead, three references cluster between $0.098 and $0.101: the 0.500 retracement around $0.098, the round $0.10 level and the 50-day SMA at $0.101. POL’s mid-October decline accelerated once price broke below this shelf, and no daily candle has closed above it since.
The moving averages explain why the shelf carries weight. The 50-day SMA still runs above the 100-day at $0.095, which runs above the 200-day at $0.090, and the three are only about $0.011 apart, a band roughly 12.5% wide. Traders usually associate that order with an uptrend. Here, though, the 50-day has been sloping lower since its mid-October peak, and POL trades below it. Clearing $0.101 would put price above all three daily averages at once.
Levels outside the current range
near $0.128
0.0 Fib: late-August peak and top of the macro range
near $0.114
0.236 Fib: capped the early-October rallies before the breakdown
near $0.105
0.382 Fib: origin of the mid-October breakdown and a September pivot, about 9.7% above the current price
$0.090 to $0.101
Current range, between the 200-day and 50-day SMAs
near $0.081
0.786 Fib: deep retracement of the July-to-August impulse
near $0.068
1.0 Fib: early-July origin of the impulse wave
RSI Clears 50 on a Partial-Volume Day
The 14-day RSI reads 51.94, above the 50 midline and 10.41 points above its signal line at 41.53. Daily momentum has moved back above neutral after spending most of October below 50.
Volume so far is 28.44 million POL, roughly $2.73 million at the current price, with about ten hours of trading left. The figure will change before the close, so it says little yet about how much conviction backs the move.
The cautious reading rests on four details. Volume is incomplete, the RSI is less than two points above 50, the 50-day SMA is still falling, and price remains below the shelf where the October breakdown began. A rebound with those features can fade under $0.098 without breaking any support.
What the Daily Close Could Settle
The November 4 close at 00:00 UTC is the first test for either reading, and a daily close above $0.101 would be the second.
Bulls keep the 100-day line
A close above $0.095, with the RSI still above 50, leaves the session high and the midpoint band as the next hurdle. Getting through $0.101 on a closing basis would return POL above the $0.10 handle and all three averages. The 0.382 and 0.236 retracements in the levels box above become the next references.
Sellers hold the midpoint band
A rejection from the $0.098 to $0.101 band that ends with a close under the 100-day SMA would keep POL inside the lower consolidation. The September floor between $0.090 and $0.091 would then be back within reach.
Both readings depend on closes that have not happened yet. The broader base holds while POL stays above the late-October lows around $0.086. A decisive daily close below that area would leave the 0.786 retracement near $0.081 as the next level down.
This story was originally published by Coindoo. Read the original article.