NEAR Sinks 12% Onto Its 200-Day SMA: Three Paths Ahead

Key Takeaways
- Friday’s high stopped under the 0.618 level.
- Price sits about 3% above the 200-day.
- RSI near 31.7, not yet oversold.
- Heavy selling volume, two hours before the close.
Two days ago, Coindoo’s analysis of NEAR’s three-level squeeze marked the 0.618 retracement near $3.23 as the floor of a 29-cent band. Friday’s candle ended that setup.
Out of the Bottom of the Band
NEAR traded at $3.34 when that analysis ran, with the 0.618 below, the 100-day average above and the upper edge of its descending channel pressing down on price.
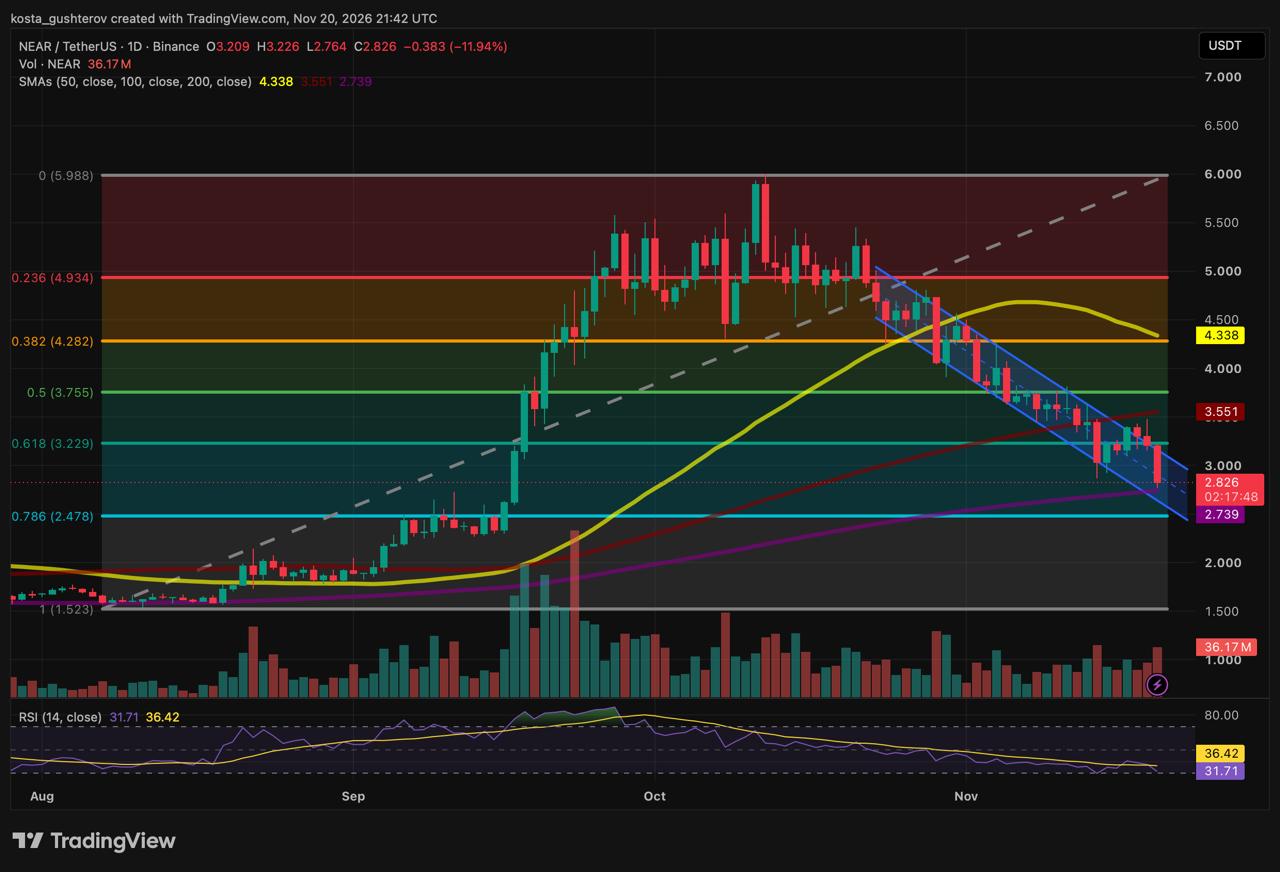
On Thursday, a push higher poked above the channel line and then closed back inside, at $3.21, just under the 0.618. Friday opened at that level and reached $3.226, less than a cent below the 0.618 at $3.229, before the selling started. The low came at $2.76. As of 21:42 UTC, with about two hours left in the session, NEAR traded at $2.83, down 11.94% on the day and about 15% below where it stood on November 18. The drop came as the broader crypto market sold off.
The three levels from November 18, two days later
0.618 retracement, near $3.23
Floor → Cap
+14% from price
Upper channel line
Under test → Held as resistance
Just under the 0.618
100-day average, now $3.55
Ceiling → Further away
+26% from price
Resting on the 200-Day
The November 18 piece laid out what losing the 0.618 would expose: the rising 200-day average, then the 0.786 retracement beneath it. NEAR is now at the first of those. The 200-day has crept up from $2.72 to $2.74 since then, and Friday’s low stopped just above it.
2.5¢ How far above the 200-day Friday’s low stopped 3.1% Gap between the current price and the 200-day 71% Share of the August–October rally given back
The averages above price point in different directions. The 50-day, at $4.34, is falling and sits near the 0.382 retracement at $4.28, making that the highest resistance band on the chart. The 100-day at $3.55 is still rising, as is the 200-day. There has been no bearish crossover between any of them yet, but the 50-day has dropped about eight cents in two days and is closing in on the 100-day from above. NEAR now trades 53% below its mid-October high near $5.99.
Inside the Channel
The descending channel that began in late October is still intact. Every rally since then has stopped at its upper line, Thursday’s included, and Friday’s high came where that line runs just under the 0.618. Price now sits in the lower half of the channel. The channel’s lower line runs below the 200-day and is sloping down toward the 0.786 level, so the two will be close together within days if the channel holds its shape.
What Sits Below the 200-Day
The levels under the 200-day map to two phases of the rally. The 0.786 near $2.48 sits in the September shelf where NEAR traded between $2.40 and $2.50 before its mid-September breakout. $2.20 sits at the lower part of that consolidation. The full retracement near $1.52 marks the August low the whole Fibonacci grid starts from.
$2.74 · 200-day › Lower channel line › $2.48 · 0.786 › $2.20 · lower shelf › $1.52 · August low
Three Ways From Here
The 200-day breaks daily close < $2.70 The rising average stops acting as support, and the 0.786 near $2.48 becomes the next reference, with $2.20 below it if the channel floor gives way. Rebounds into the $3.00–$3.15 zone would be the first test from underneath. The break fails dip < $2.74, fast reclaim > $2.80 A quick move back above $2.80 after a dip under the 200-day would leave sellers trapped below the average. The deeper version is a washout into $2.45–$2.50, where the 0.786 meets the September shelf, with RSI falling into the low-to-mid 20s. The channel breaks upward daily close > $3.30–$3.35 NEAR would be back above the 0.618 and outside the channel, with the 100-day at $3.55 and the 0.5 near $3.76 next. The November 17 close near $3.40, which unwound within two days, shows that a single close up there isn’t enough on its own.
For now, the nearest support is the 200-day, about 3% below price, and the nearest resistance is the 0.618, about 14% above.
Chart: NEAR/USDT daily, Binance, via TradingView, captured November 20, 2026, at 21:42 UTC with the daily candle still open. The Fibonacci retracement is drawn from the August low to the mid-October high.
This story was originally published by Coindoo. Read the original article.