Ethereum Price Jumps 7% Into the $2,500 Ceiling: Levels to Watch

Key Takeaways
- ETH up 7.35% to $2,442 intraday.
- Day high $2,450, under 0.236 near $2,497.
- RSI crossed 50 and its signal line.
- 0.236 Fib and 50-day SMA lie $12 apart.
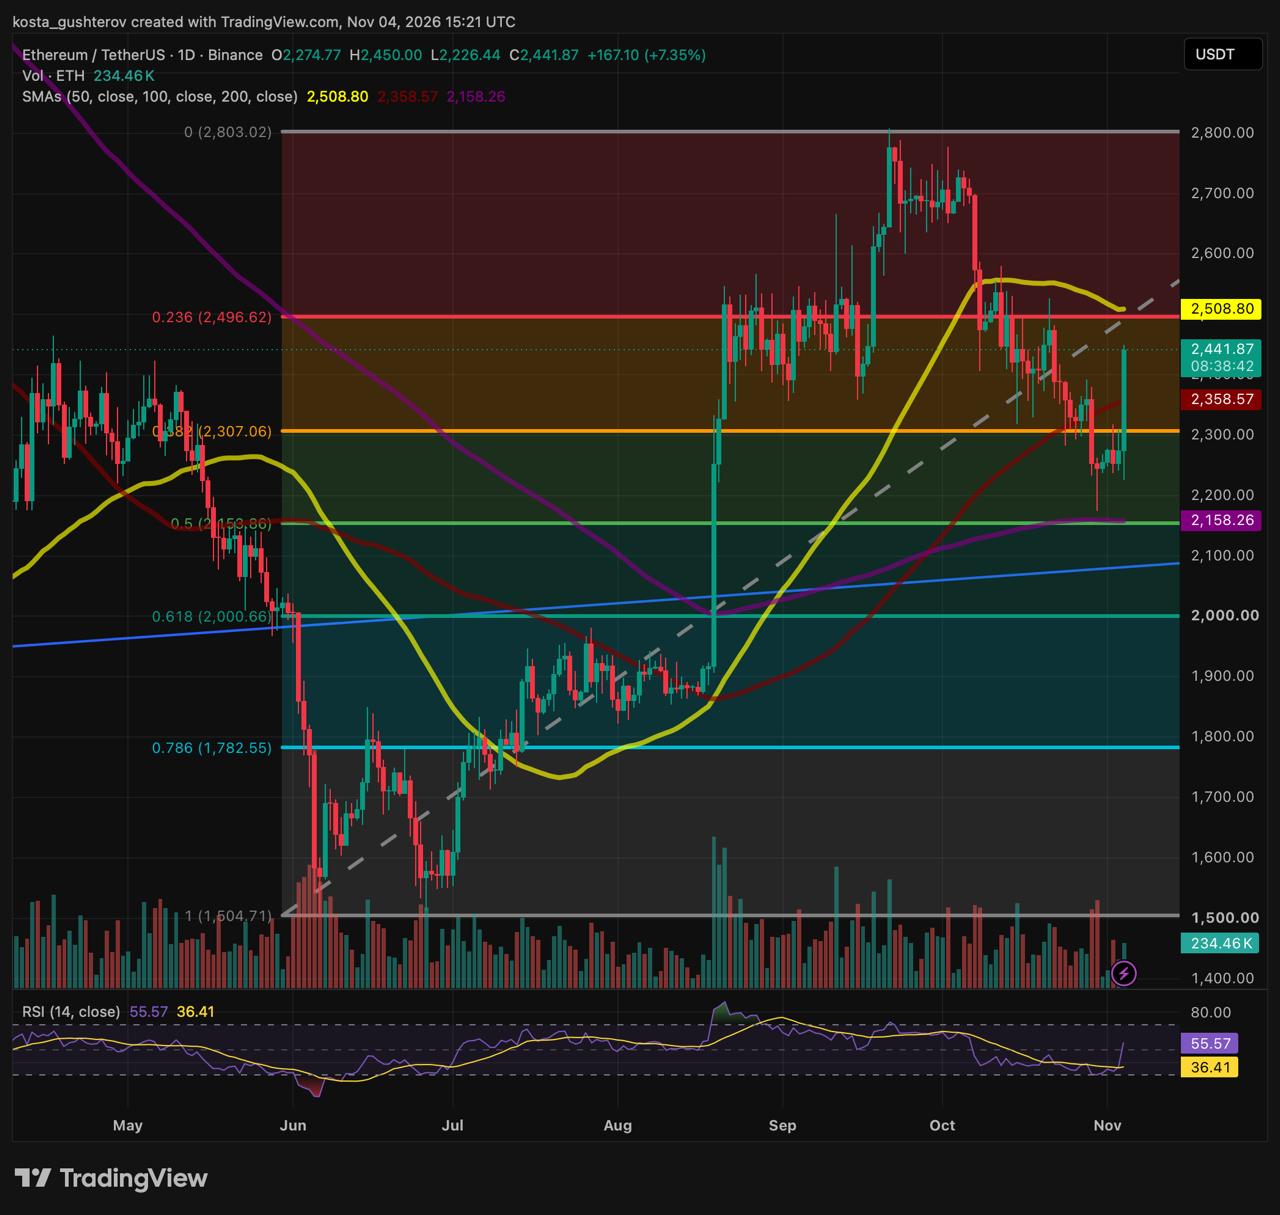
ETH traded at $2,442 at 15:21 UTC, up $167 on the day, according to TradingView’s Binance ETH/USDT chart.
One Session Through the Broken Zone
Our November 1 analysis caught ETH just after a flush into the 0.500 Fibonacci level near $2,154 and the 200-day SMA. It marked the broken zone between the 0.382 retracement near $2,307 and the 100-day average as the first area to test. Today’s candle covered that ground in one session. It opened at $2,275, dipped to $2,226 and then climbed through both levels, leaving ETH about $83, or 3.5%, above the 100-day SMA at $2,359.
That is a $224 range from low to high, and the candle still has hours to run. Whether the move above the 100-day counts as a daily reclaim depends on the daily close.
What Moved Since November 1
How the daily readings changed between the two snapshots:
| Daily reading | Nov 1 | Since then |
|---|---|---|
| ETH price | $2,269 | +$173 |
| 50-day SMA | $2,517 | −$8 |
| 100-day SMA | $2,346 | +$13 |
| 200-day SMA | $2,159 | −$1 |
| 14-day RSI | 33.83 | +21.74 |
| RSI signal line | 36.48 | −0.07 |
Snapshots taken at 16:48 UTC on November 1 and 15:21 UTC on November 4.
The RSI jump took the 14-day reading to 55.57, above both the 50 midline and its signal line at 36.41, after dipping close to oversold territory in late October. The averages tell a slower story. The 100-day kept rising while the 50-day kept sliding, cutting the gap between them from $171 to $150, a sign that October’s selling still weighs on the shorter average.
The Band Where October’s Rebounds Stalled
The 0.236 retracement around $2,497 and the 50-day SMA at $2,509 lie only $12 apart. ETH consolidated across this resistance band from late August to mid-September, broke down through it in October, and has stalled around it on each rebound since. On the higher timeframe, the November 1 analysis placed the 50-month average at $2,471, just beneath the band.
The session high of $2,450 stopped $47 short of the 0.236 level and below that monthly line as well, and ETH trades about 2.2% under the Fib. The 50-day half of the ceiling is drifting down toward price, while the Fib level stays put. Above the band, the chart shows a second consolidation area around $2,700 from late September and early October, and the cycle peak at the 0 Fib near $2,803.
A one-day 7% run into the 50-day average is also how October’s rebounds looked before they stalled. If the band holds again, this move would mark a lower high under October’s peak.
Checkpoints for the Next Closes
Three outcomes, each defined by where ETH closes. The nearest test is the 100-day SMA at the 00:00 UTC close.
$2,307 to $2,359
A pullback that holds
A controlled dip that stays above the 0.382 level near $2,307 and the 100-day SMA would set a higher low beneath the ceiling and keep a second attempt at $2,500 open. A daily close back below $2,226, today’s low, would cancel the rebound structure.
Inside $2,495 to $2,515
The band turns price back
Exhaustion wicks, fading volume or a bearish engulfing candle inside the band would point to a lower high. A rotation from there could run back through $2,307 toward the 0.500 level near $2,154 and the 200-day SMA at $2,158, the floor tested at the end of October. Sustained daily acceptance above $2,520 to $2,550 would rule this path out.
Above $2,510
Buyers take the ceiling
A daily close and acceptance above $2,510 would clear both the 0.236 level near $2,497 and the 50-day SMA. That would leave the $2,700 consolidation area and the $2,803 peak as the next references above.
Wider frame: the 0.500 and 200-day cluster remains the line for the broader uptrend. Beneath it, the 0.618 retracement near $2,001 lies next to the round $2,000 mark, with the rising trendline around $2,080 just above it.
This story was originally published by Coindoo. Read the original article.