Ethereum Price Holds Major Floor as Bulls Fight Back

Key Takeaways
- ETH got back above a trendline from 2021.
- 200-day SMA and 0.500 Fib held the drop.
- Resistance stacks near $2,500 on both timeframes.
- Daily RSI hooked up from near 30.
ETH traded at $2,269 at 16:48 UTC on Sunday, up about 0.6%, or $13, on the day, according to the Binance ETH/USDT chart.
Zoom out: a line drawn in 2021
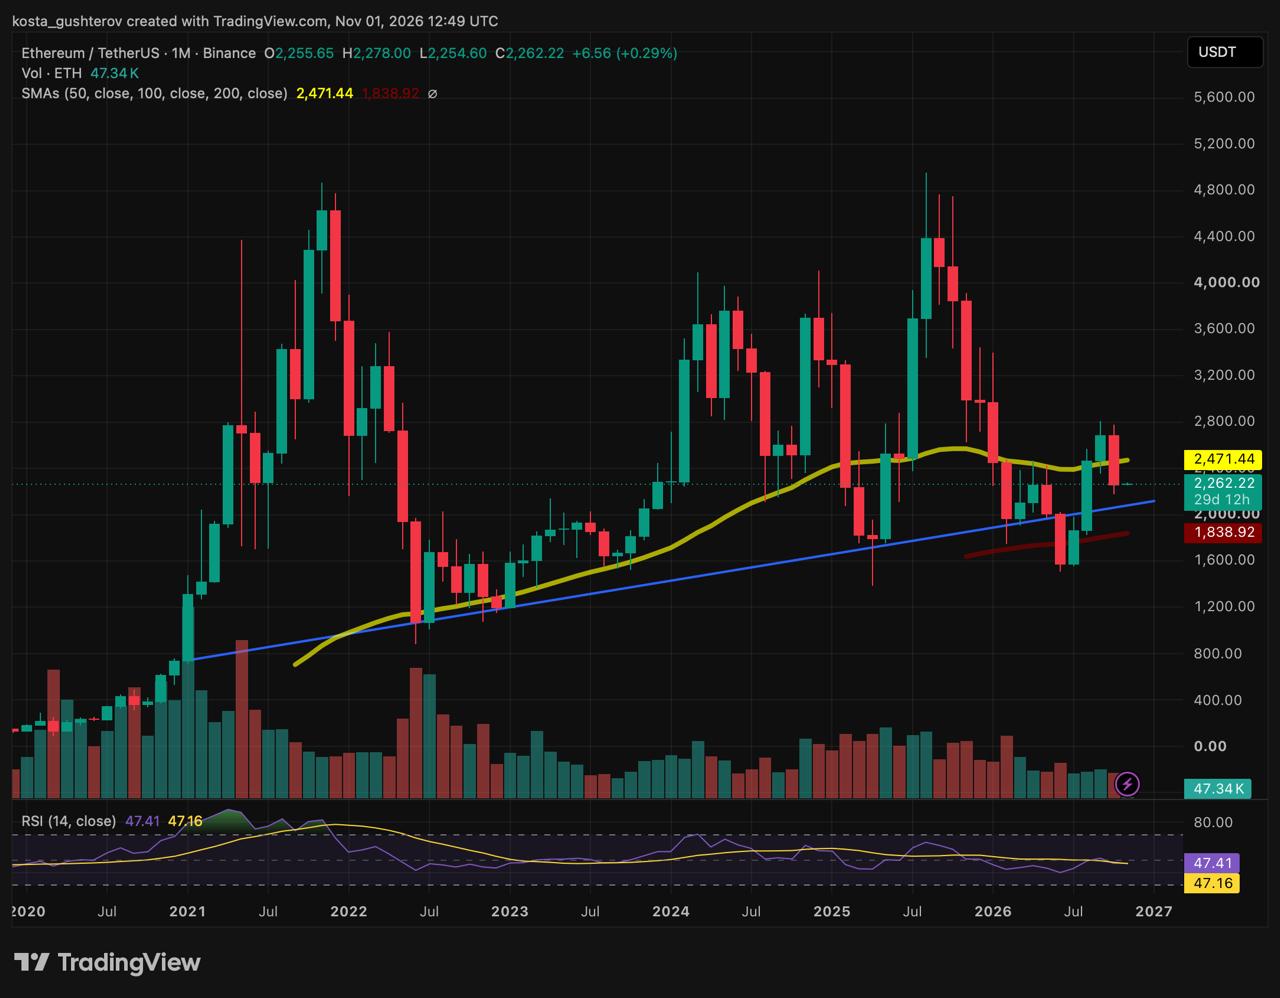
On the monthly chart, a rising blue trendline starts in early 2021 near $750 to $800. It caught the 2022 low and has guided Ethereum’s long-term uptrend since, though not without breaks: a monthly wick dipped below it in 2025, and in mid-2026 price fell through it and bottomed at $1,505, close to the rising red 100-month average at $1,839.
A strong late-summer surge then pulled ETH back above the line and carried it to a peak of $2,803. August and September closed above the yellow 50-month average at $2,471, but October’s red candle fell back below it and returned to the trendline, which now rises through roughly $2,100. The month closed at $2,256, and November opened above the line.
Momentum on this timeframe is balanced. The 14-month RSI reads 47.41, just above its yellow signal line at 47.16, which points to a long-term trend that is steadying rather than breaking down.
Zoom in: the flush and the floor
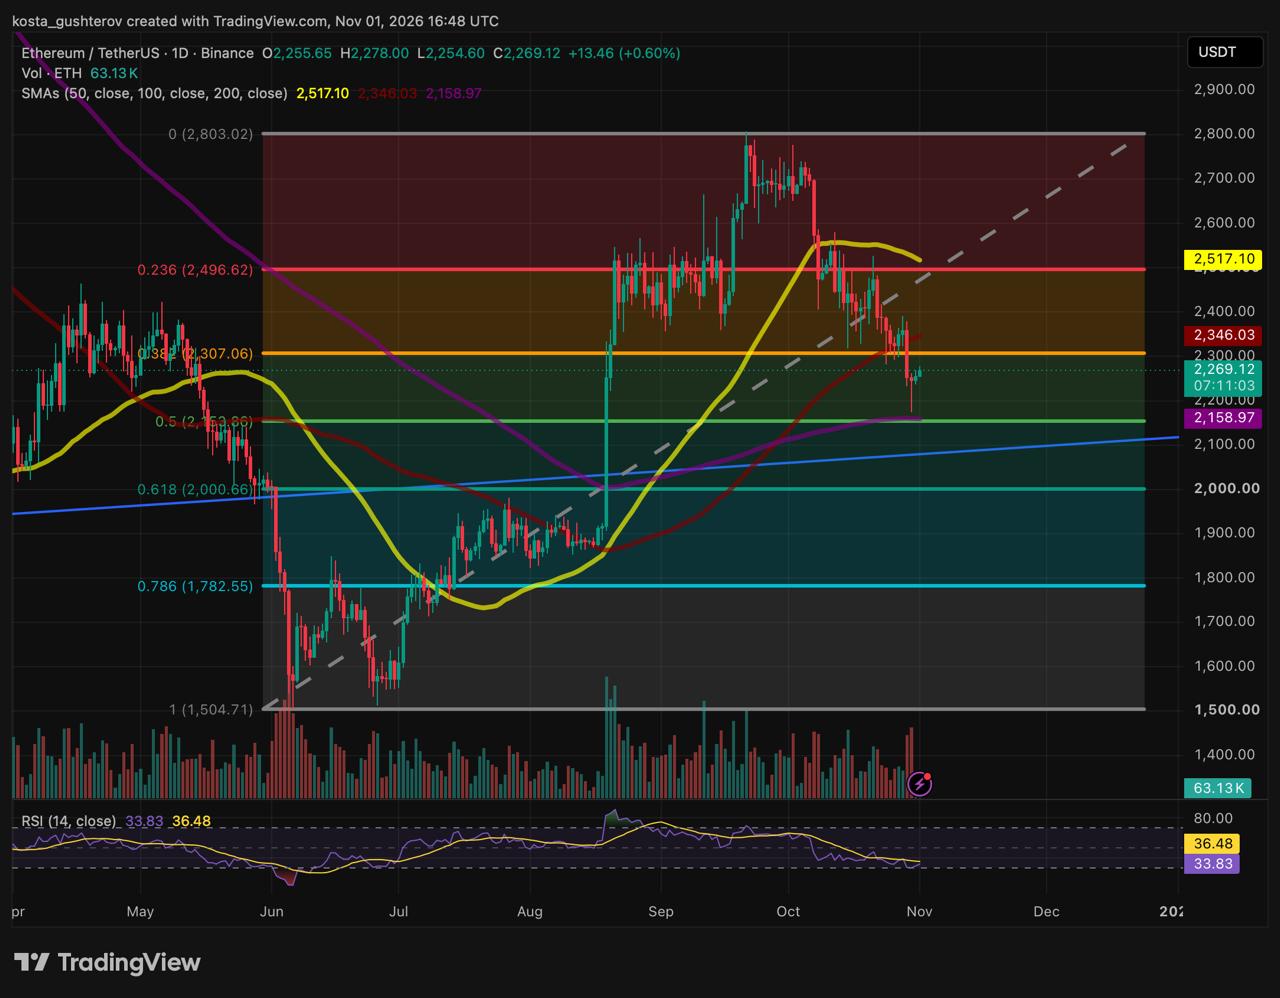
The daily chart shows how close the test came. In late October, ETH lost its red 100-day average at $2,346 and the 0.382 Fibonacci level near $2,307. Yesterday’s candle then flushed down into the 0.500 Fibonacci midpoint near $2,154 and the purple 200-day average at $2,159, with the monthly trendline running just beneath. Buyers stepped in at that stack and pushed the close back to $2,256.
Today the selling has not returned. The candle opened at $2,256, dipped just a dollar to $2,255, climbed to $2,278 and was trading at $2,269. Volume has picked up to 63,130 ETH, roughly $143.2 million, without any revisit of yesterday’s lows.
The 14-day RSI dropped close to the 30 oversold mark during the flush, its lowest reading since the June bottom, and is now hooking up at 33.83, closing the gap to its signal line at 36.48.
Where the two charts meet
Taken together, the two timeframes box Ethereum into a corridor between roughly $2,100 and $2,517, with both the floor and the ceiling built from more than one chart. The floor is unusually tight: its three references sit within about 3% of each other. The ceiling near $2,500 is just as crowded, and it is where October’s daily recovery attempts kept stalling. The daily averages also remain in bullish order, with the 50-day above the 100-day and the 100-day above the 200-day.
Our read is that the mid-2026 dip below the trendline looks, in hindsight, like a bear trap, and October’s pullback like a retest of support that had been won back. Today’s near-zero lower wick suggests sellers ran out of steam at the floor, just as daily RSI neared oversold. If that holds, the broken $2,307–$2,346 zone would be the first area to test, with the $2,500 ceiling still standing beyond it.
Every level on the map, and which chart it comes from:
$2,803 1D Cycle peak, the 0 Fib, set in late September
$2,471-$2,517 BOTH 50-month SMA ($2,471), 0.236 Fib near $2,497, 50-day SMA ($2,517)
$2,307-$2,346 1D 0.382 Fib and 100-day SMA, the broken zone to reclaim
$2,278 BOTH Today’s high, the first small hurdle
$2,269 NOW Up 0.6% on the day
$2,255–$2,256 BOTH November’s monthly and daily open, and today’s low
$2,154–$2,159 1D 0.500 Fib midpoint and 200-day SMA, the main floor
~$2,100 1M The rising trendline from 2021, reclaimed support
$2,001 1D 0.618 golden pocket, next to the round $2,000
$1,783-$1,839 BOTH 0.786 Fib near $1,783 and the 100-month SMA ($1,839)
$1,505 1D June low near the 1.0 Fib, where the rally began
Fibonacci levels are drawn on the daily chart from the June low to the cycle peak. 1M = monthly chart, 1D = daily chart.
What would tip it
Each path depends on how the next closes land, not on a call about which one comes.
Toward the ceiling. A daily close firmly above $2,265 and a break of today’s $2,278 high, with daily RSI crossing back above its signal line, could open a test of the 0.382 level near $2,307 and the 100-day at $2,346. A daily close back above $2,346 would repair the late-October breakdown and put the upper end of the corridor, from the 50-month average at $2,471 to the 50-day at $2,517, back within reach.
Through the floor. If the move against the longterm resistance stalls under the $2,307-$2,346 zone and ETH then posts a daily and weekly close below both the 200-day at $2,159 and the trendline near $2,100, the three-layer floor would be gone and the trendline retest would have failed. That would expose the golden pocket near $2,001, with deeper support at the 100-month average at $1,839 and the 0.786 level near $1,783.
The long lens
Even the second path would leave ETH well above its June low at $1,505. What it would cost is the 2021 trendline itself, the line Ethereum has now reclaimed once this year and tested once since.
This story was originally published by Coindoo. Read the original article.