Crypto’s Cash Supply Is Shrinking at Its Fastest Since 2022
Key Takeaways
- $14.2B stablecoin drop, fastest since June 2022
- Tether and Circle redemptions drive most of it
- Bitcoin ETFs shed $1.58B across November 2–10
- Only two whale cohorts are buying the dip
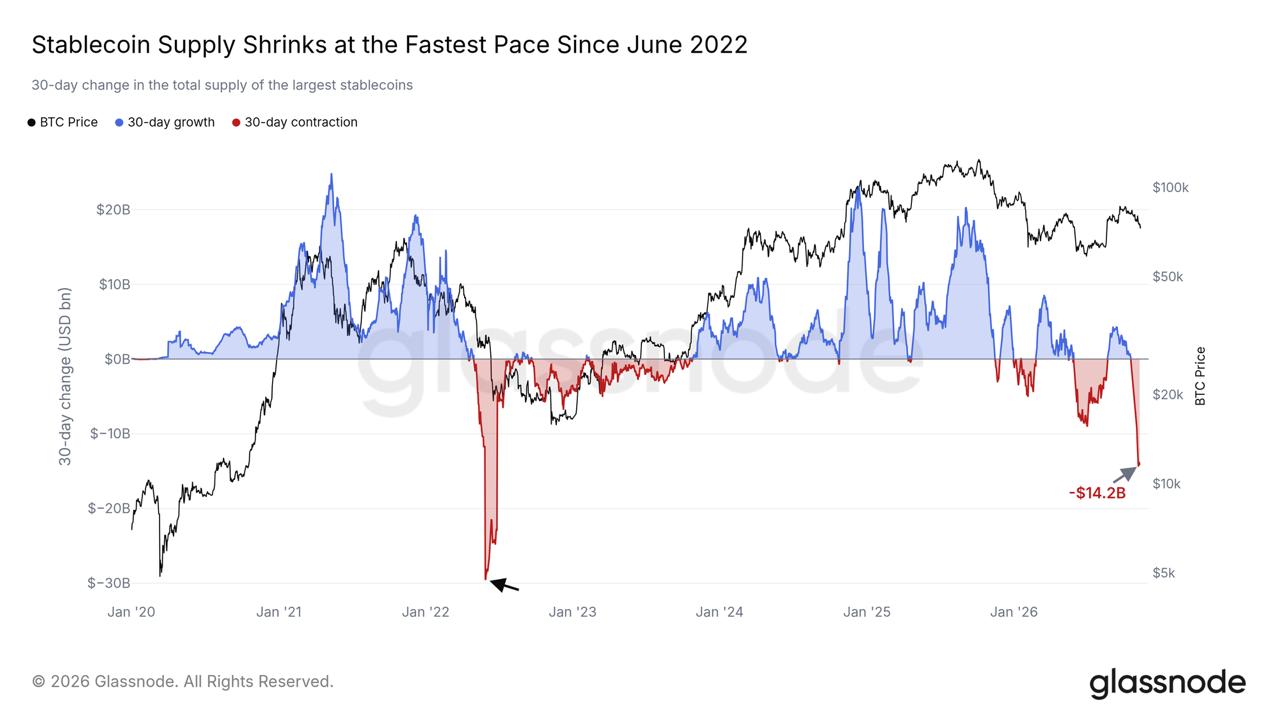
Glassnode’s November 11 report, “Running on Empty,” puts the 30-day contraction at $14.2 billion and calls it the fastest since June 2022, when the market was still deleveraging after the Terra collapse and the Celsius and Three Arrows failures. According to The Block’s reading of the same data, that 2022 episode saw the 30-day decline approach $30 billion, roughly five months before Bitcoin bottomed near $15,500 that November. The current drop is about half that size, which is the context the headline comparison needs.
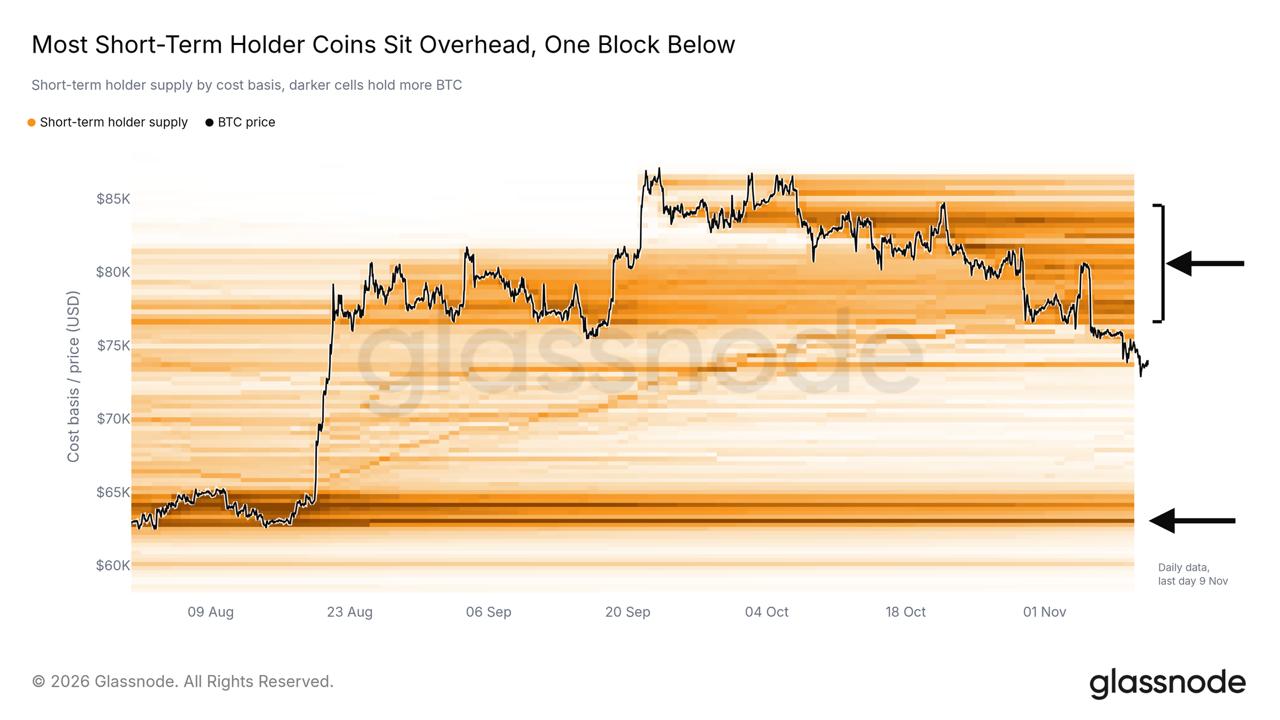
Bitcoin traded around $74,300 on Coinbase at 17:33 UTC on November 11, below the $75,600 short-term-holder cost basis Glassnode uses as the estimated acquisition price of coins held under 155 days, and below the $77,800 election-day close the report treats as the level that would put Bitcoin back in step with US stocks.
Tether and Circle are doing most of the redeeming
Glassnode’s figure comes from a fixed basket of 11 dollar tokens counted at $1 per unit, so it measures units leaving circulation, not a price effect. The broader DefiLlama series, which tracks more tokens, shows a slightly larger $15 billion decline over the 30 days to November 7, from $307 billion to $292 billion. Total supply peaked near $316 billion on May 17 and stood at about $295 billion on November 9. The three heaviest single days were October 29, November 3 and November 7, each above $1.4 billion.
Two issuers account for about two-thirds of the weekly damage. Tether and Circle together redeemed $4.4 billion in the week to November 7, and eight of the ten largest tokens shrank. The exceptions were the yield-bearing synthetics: Ethena’s USDe and Ripple’s RLUSD both grew.
Supply movers, October 31 to November 7
| Token | Supply Nov 7 | Week change |
|---|---|---|
| USDT (Tether) | $177.00B | −$3.10B |
| USDC (Circle) | $70.60B | −$1.31B |
| USDS (Sky) | $5.59B | −$0.86B |
| USD1 (World Liberty) | $3.54B | −$0.36B |
| BUIDL (BlackRock) | $1.76B | −$0.25B |
| USDG (Global Dollar) | $2.72B | −$0.22B |
| USDe (Ethena) | $4.92B | +$0.40B |
| RLUSD (Ripple) | $2.69B | +$0.27B |
Source: DefiLlama stablecoin supply data. US dollars.
The growth in USDe is worth a line because it shows the limit of reading the total as a fiat-exit ledger. Ethena’s documentation describes redemptions that return USDT or USDC rather than bank dollars, so a synthetic can expand while the tokens backing it shrink. Glassnode also notes Tether trading slightly below $1, a second sign that redemption demand is running ahead of issuance.
ETFs are the second drain
Glassnode’s ETF reading shows roughly $1.6 billion of net outflows across the 20 sessions through November 9. Farside Investors’ daily figures put $1.58 billion of that in the seven sessions since November 2, with November 4 the only inflow, $201 million leaving on November 9 and a further $95 million on November 10, after Glassnode’s cutoff. Coindoo’s earlier breakdown of those flows showed how much of the withdrawal came from a single issuer.
ETF outflows aren’t the same as spot selling: the SEC permits in-kind redemptions, so some of that Bitcoin left the fund without being sold. What the two drains share is direction. Dollar tokens and the main regulated access route are both losing balance in the same month.
Who is buying anyway
Against that backdrop, Glassnode’s accumulation model shows two cohorts adding coins: wallets holding 100–1,000 BTC and 1,000–10,000 BTC. Every other size band, including the largest above 10,000 BTC, is on the distribution side. The report adds that the slide has cleared most long leverage near the current price and that bids outweigh asks in the spot order book, which is the supportive half of its argument.
The same two cohorts did this once already. Glassnode notes they turned briefly to accumulation in late September before that buying faded, and Bitcoin has since fallen through the short-term-holder cost basis. A second attempt from the same groups, with no other cohort joining, is the pattern to read with some care.
It also explains how accumulation and a shrinking stablecoin supply can coexist. Say a buyer spends 10,000 USDC on Bitcoin. The seller now holds the USDC, Bitcoin has changed hands, and no new stablecoin was minted. If the seller then redeems, supply falls while the accumulation score rises. Glassnode’s score weights entity balances and their changes, excluding exchanges and miners; it is a measure of who is adding coins, not of how many fresh dollars arrived to pay for them.

Fake USDT on BNB Chain: The $1 Is Real, the Exit Isn’t
The levels where the bid gets tested
The nearest overhead reference is the $75,600 short-term-holder cost basis, the level Coindoo’s earlier analysis of underwater recent buyers identified as where holders who bought in the past five months break even. Above it sits the $77,500 True Market Mean, Glassnode’s active-investor cost reference, which the report says would return roughly half of short-term-holder supply to profit if reclaimed, and the $77,800 election-day close.
Below, Glassnode’s $73,000 reference marks the downside check. Reclaiming $75,600 with ETF flows turning positive over several sessions would support the view that the two cohorts have company. A sustained break of $73,000 while supply keeps contracting would suggest they do not. Price alone, crossing either level on a thin day, settles neither question.
What could change the picture
Glassnode’s own test is simple: it writes that a return to stablecoin supply growth would be the first sign of new money coming in. The rolling 30-day figure needs one adjustment when applying that test. The October 29 and November 3 drops, both above $1.4 billion, will leave the window in late November and early December, at which point the monthly total can improve without a single new dollar arriving. The daily and weekly series on DefiLlama, not the rolling total, show whether redemptions have actually stopped.
Until they do, the dip is being bought with liquidity already inside the system, by two cohorts that tried this in September. That can carry a bounce. It has not yet carried a recovery.
Data context: Glassnode’s stablecoin, ETF, cost-basis and accumulation readings run through November 9, 2026. DefiLlama supply figures are as of November 7 and November 9. Farside’s additional flow data cover November 10. The Coinbase price quote is timestamped November 11 at 17:33 UTC.
This story was originally published by Coindoo. Read the original article.