Bitcoin Midterm Pattern: Clear Trend or No Pattern?

Cointelegraph and CryptoBriefing disagree on whether Bitcoin shows a historical bearish pattern around US midterm elections.
Cointelegraph and CryptoBriefing disagree on whether Bitcoin shows a historical bearish pattern around US midterm elections.
What all sources agree on
- Bitcoin held above its 100-day moving average ahead of the US midterm elections.
- The week includes US midterm elections, Apple and Palantir earnings, and the October jobs report.
- Analyst Rekt Capital compared Bitcoin's current chart to its 2023 recovery.
- A support zone near $76,300 is identified as significant and aligned with the 100-day moving average.
Where the reports disagree
1Whether Bitcoin's performance in past midterm years shows a clear bearish pattern
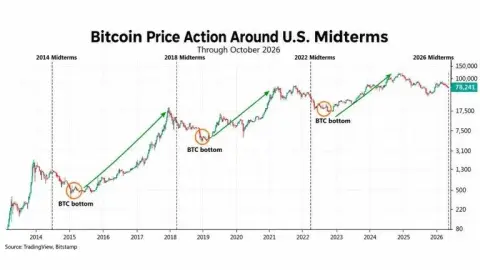
Bitcoin ended the fourth quarter lower in each of the past three US midterm election years, falling 17.3% in 2014, 43.5% in 2018 and 14.8% in 2022. All three periods coincided with Bitcoin bear markets.
Cointelegraph 2026-11-02 09:41
Bitcoin's performance across previous midterm cycles has been mixed, with no definitive pattern.
CryptoBriefing 2026-11-02 09:56
What would settle it: Historical BTC/USD quarterly price data for Q4 of 2014, 2018, and 2022 from a verifiable market data provider.
What to make of it
Treat the shared technical levels (100-day moving average, $76,300 support) and the week's calendar of events as established; do not treat claims about a historical midterm-year price pattern as settled, since the two outlets characterize the same history differently.
Treat the shared technical levels (100-day moving average, $76,300 support) and the week's calendar of events as established; do not treat claims about a historical midterm-year price pattern as settled, since the two outlets characterize the same history differently.
This story was originally published by The Coin Rise. Read the original article.