Zcash Price Loses $1,000 on 14% Dip: Where It Could Stop
Session low $961, near the 0.5 Fibonacci Daily RSI 34.56, 13 points under signal Now overhead Broken 100-day SMA at $1,080 Next confluence $786-$801 below the midpoint
ZEC is down about 14% over the past 24 hours, according to CoinMarketCap data at the time of writing, a move that erased more than a month of slow gains inside the ascending channel in two sessions.
What gave way, in order
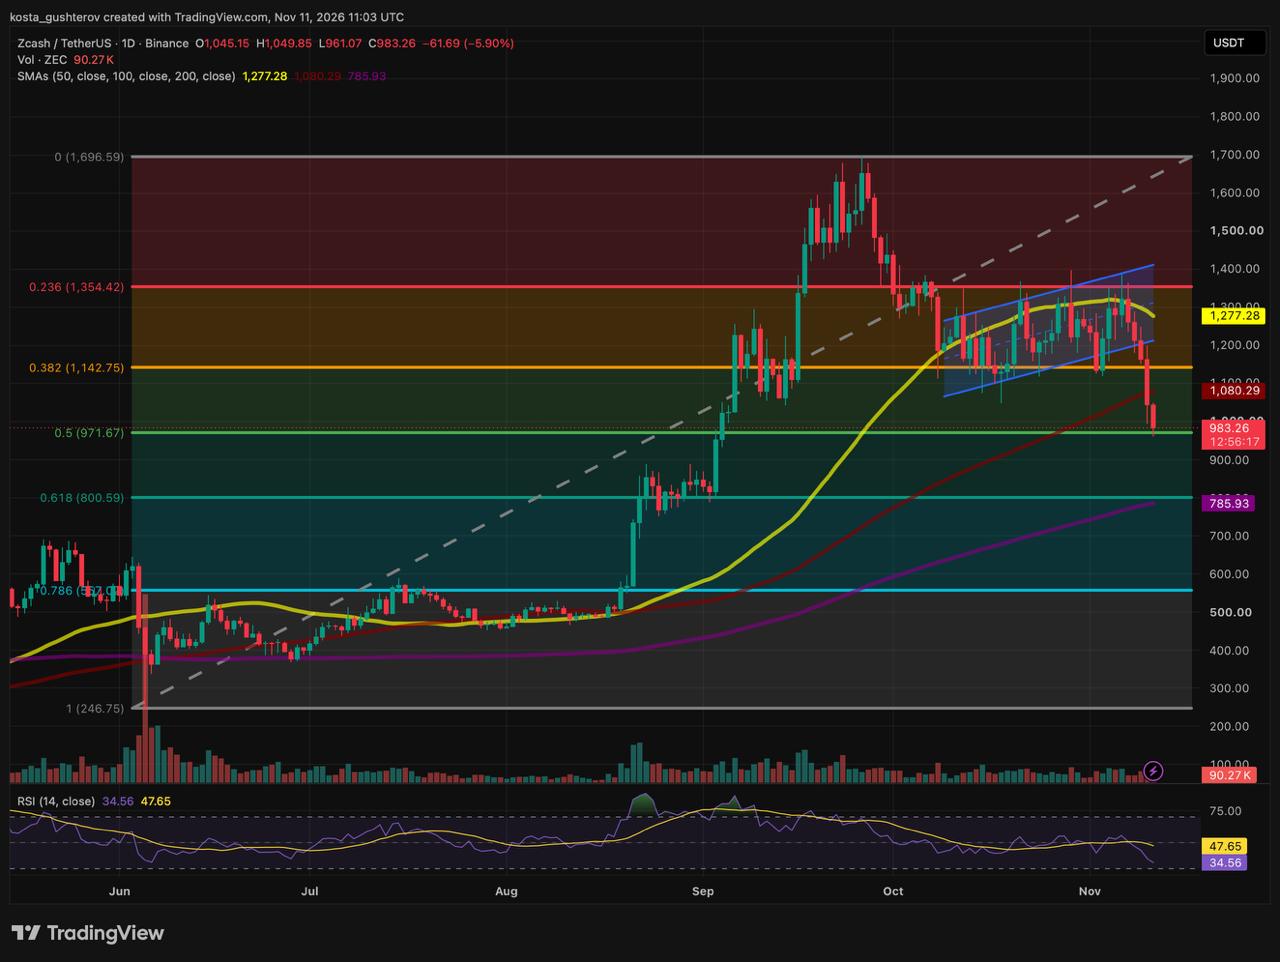
Through October and the first days of November, ZEC climbed inside a blue ascending channel while most of the market bled. That relative strength had a structural problem: the channel formed after the impulsive drop from the $1,697 September peak, overlapped heavily, and never cleared the 50-day SMA, which curled over at $1,277 and capped every attempt. A rising, overlapping channel beneath a rolling 50-day average after a cycle top is the shape technicians read as a bear flag, and it resolved the way flags usually do.
Yesterday the lower rail of the channel, around $1,215, broke first. The 0.382 Fibonacci retracement near $1,143 went next. Stops that had accumulated under the channel for five weeks triggered together, and the resulting long liquidation ran straight through the 100-day SMA at $1,080 in a single expansion candle without a pause.
Today’s session opened at $1,045 and managed a $5 lift to $1,050, about $30 short of retesting the broken 100-day average from below, before a second wave of selling took price through $1,000 to an intraday low of $961. That low sits roughly $10 under the 0.5 Fibonacci midpoint around $972; limit buyers absorbed the sweep and pulled price back to $983 by the time of writing.
Why $972 stopped it
The June-to-September advance covered $1,450 of vertical distance, from $247 to $1,697. At the midpoint around $972, ZEC has given back exactly half of it. The 0.5 level often attracts clustered spot bids and algorithmic orders on its first touch, which could be the simplest explanation for the $22 lower wick off $961.
Behind the bounce is the chart’s emptiest stretch. ZEC moved from about $800 to $971 in three vertical green candles at the turn of August into September and built no horizontal base on the way. There is no volume shelf between the midpoint and the 0.618 retracement close to $801. If the midpoint goes, the next structural support is that 0.618 level together with the rising 200-day SMA at $786 and the late-August consolidation, roughly $170-$185 lower.
The RSI tells the same story faster
In 48 hours the daily 14-period RSI dropped from 48.56 to 34.56, opening a 13.09-point gap beneath its signal line at 47.65. That is the sharpest two-day momentum dislocation of ZEC’s 2026 cycle. It leaves the indicator 4.56 points above the 30 oversold threshold, a zone where sellers have historically had to pause or allow a relief test of broken support before pressing further, though the indicator alone does not force one.
The full ladder
Levels anchored to the macro impulse from the $247 June base to the $1,697 September peak, top to bottom.
$1,697 Cycle peak · 0.0 Fibonacci, origin of the correction near $1,354 Channel ceiling · 0.236 Fibonacci, capped early November $1,277 Rolling 50-day SMA · rejected every channel high $1,143-$1,215 Broken channel base · 0.382 Fibonacci (near $1,143) and the former lower rail $1,050-$1,080 First overhead hurdle · today’s high and the broken 100-day SMA $961-$1,000 Price is here · session low, 0.5 Fibonacci around $972, round number $786-$801 Macro confluence · 200-day SMA, 0.618 Fibonacci (close to $801), August base $557 / $247 Deep retracement · 0.786 Fibonacci and the June launch low
Two ways off the midpoint
From $983 the chart offers one setup in each direction. Neither is a prediction.
Path one · the midpoint holds
The 100-day SMA was broken without an underside test, and the RSI gap to its signal line is wide. Sellers who chased the move below $1,000 are exposed to a short-covering squeeze if bids keep holding the $961-$972 floor.
Reclaiming $1,000 would open a mean-reversion move toward today’s $1,050 high and a retest of the broken 100-day average at $1,080, with the 0.382 level near $1,143 as the stretch target. The reaction at $1,080 would separate a dead-cat bounce from a V-shaped recovery; a rejection there would keep the flag breakdown intact.
Path two · the midpoint fails
Should the broader market stay heavy and continued capitulation from the broken channel absorb the spot bids at the midpoint, the absence of volume structure below $960 would leave little in the way.
A decisive close under $972 and the $961 session low would open the path toward the 0.618 retracement close to $801 and the 200-day SMA at $786, where the late-August consolidation shelf also sits.
The larger frame is unchanged by either path. Until ZEC closes back above the 50-day SMA at $1,277 and the channel ceiling near $1,354, the September peak at $1,697 remains the origin of an unfinished correction, and bounces from the midpoint are retests of broken levels rather than a new trend.
ZEC is not falling alone
The breakdown lands in a market that is red across the board. Bitcoin slipped under $74,000 after October’s CPI, released November 10, came in hotter than expected at 0.4% month-on-month with core holding at 0.3% for a third month, a print that Anadolu reports pushed BTC toward a three-month low and triggered roughly $178 million of long liquidations within an hour. With the fed funds rate already at 3.75%-4.00%, CoinDesk reports traders are pricing an 88% chance of a 25-basis-point hike at the December 9 meeting, and Fed Governor Christopher Waller has said a 50-point move is on the table if inflation does not cool.
The same pressure is visible in the weekly numbers, with more than $1.28 billion leaving spot Bitcoin ETFs in a week and Ethereum ETFs posting a sixth straight week of withdrawals, and in the charts: Ethereum has erased its August breakout and is testing $2,000, Solana is holding its last support as hike odds climb, and XRP has fallen out of its own channel with $0.99 in sight. Layered on top is the post-midterm picture, where Democratic control of both chambers has narrowed the Clarity Act’s path to 60 votes and cooled expectations for near-term crypto legislation. ZEC’s five weeks of relative strength were an exception to that backdrop; the last two days closed the gap.
Disclaimer: This article is for informational purposes only and does not constitute investment, financial or trading advice. The levels discussed are drawn from Coindoo’s own technical analysis and are scenarios, not forecasts. Cryptocurrency markets are highly volatile; always do your own research and consult a licensed financial adviser before making any investment decision.
This story was originally published by Coindoo. Read the original article.