
Zcash Price Holds Up as BTC Slips – Base or Bear Flag?

Key Takeaways
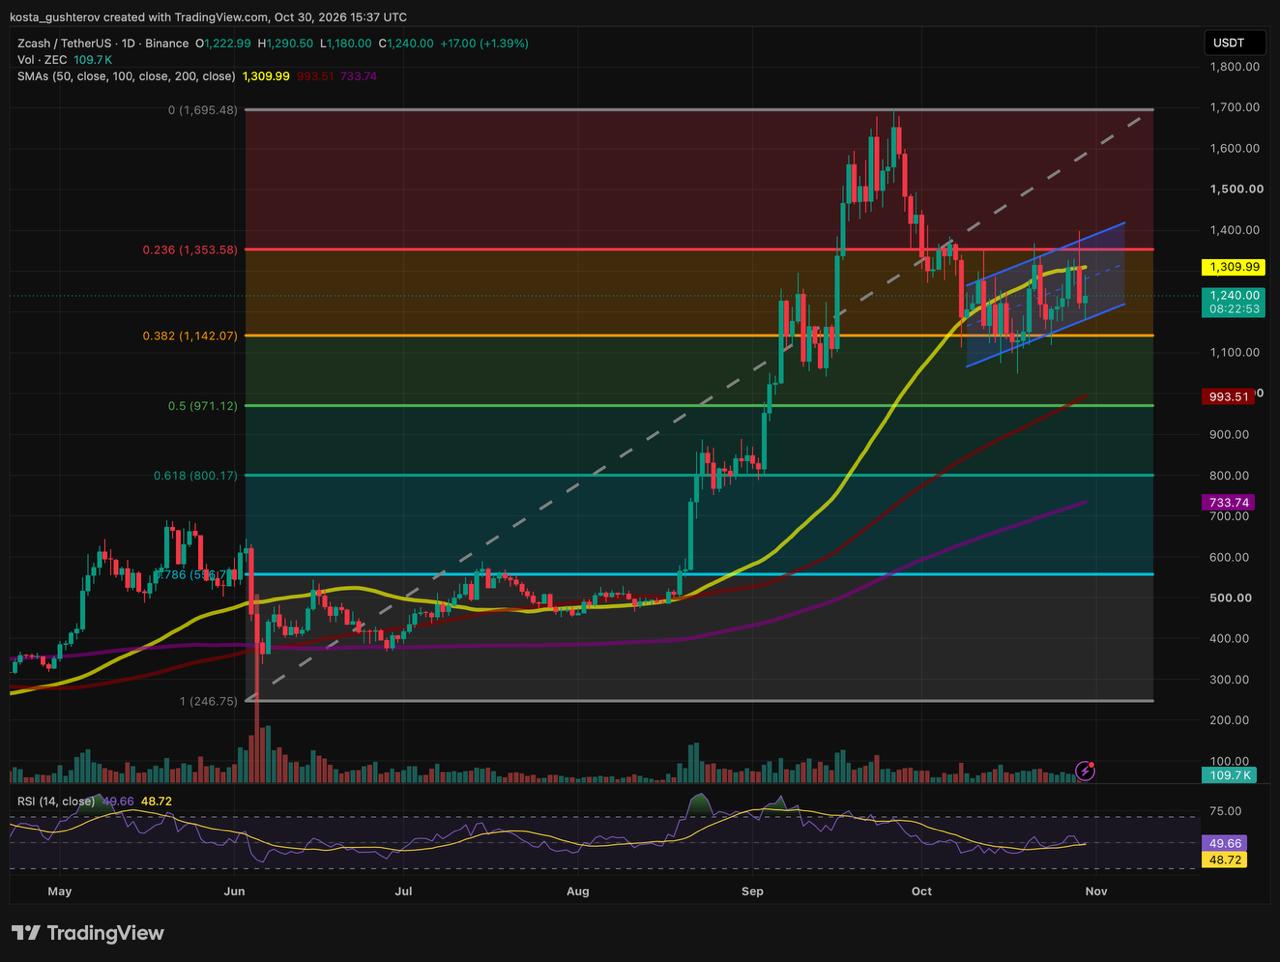
- ZEC bounced off its rising channel near $1,180.
- 50-day SMA near $1,310 keeps capping rallies.
- RSI near 50 shows a standoff.
- Below $1,142, the $971-$994 zone is next.
ZEC traded at $1,240 at 15:37 UTC on Friday, up about 1.4% on the day, according to the Binance ZEC/USDT daily chart.
Why is Zcash holding up when the market isn’t?
Today’s candle opened at $1,223, dipped to $1,180, reached $1,291 and was trading at $1,240, on 109.7K ZEC of volume. That dip landed right on the lower rail of the channel ZEC has been building for the past six days, about $38 above the horizontal floor at the 0.382 Fibonacci level near $1,142.
A week ago, ZEC was simply testing that floor from above. Since then, each pullback has stopped a little higher than the last, tracing the rising channel shaded blue on the chart:
That is a different picture from the rest of the market. Bitcoin slid this week to test its $76K support shelf, and XRP has been correcting inside a falling channel since late September. ZEC buyers, by contrast, have stepped in higher on every dip for the past days.
The network marked its tenth anniversary on October 28, and its NU7 upgrade, which cuts target block times from 75 seconds to 25, is scheduled for around November 5. Both dates fall inside the stretch in which ZEC has outperformed.
So why isn’t that the whole story?
Because the channel keeps hitting the same ceiling. Two sessions ago, a strong green candle pushed above the 50-day SMA to test the area close to the 0.236 Fibonacci level near $1,354, but sellers answered yesterday with an engulfing red candle that took price straight back below $1,310. Today’s rebound stalled at $1,291, about $19 short of the average. Each test of that $1,310-$1,354 band has met sellers treating the push higher as a chance to exit.
The timing of the channel adds to the doubt. It formed right after a steep October drop from the $1,695 cycle peak to around $1,080. A choppy, overlapping channel that slopes up against a sharp fall, and fails at the 50-day SMA, carries the signature of a bearish continuation flag.
Reading 1: a base being built
higher lows each dip bought higher
relative strength rising while BTC and XRP fall
holding the floor buyers active above the 0.382 Fib
Reading 2: a bear flag
after a sharp drop $1,695 down to around $1,080
overlapping candles choppy, not impulsive
capped no sustained close above the 50-day
Both readings fit the same candles. Which one holds depends on the channel’s edges: a break above the ceiling, or a break of the lower rail.
Who is in control right now?
← sellers’ side50buyers’ side →
RSI 49.7 · signal 48.7
Nobody, yet. The 14-day RSI sits at 49.7, almost exactly on the neutral 50 line and only a touch above its 48.7 signal line. That reading reflects a standoff between dip buyers defending the lower rail and sellers defending the ceiling, and it says little about direction until price leaves the channel.
Where the levels sit
0$1,695 · cycle peak and origin of the October drop 0.236near $1,354 · channel ceiling and major hurdle, in line with the upper rail 50D$1,310 · 50-day SMA, the dynamic ceiling cutting through the channel NOW$1,240 · ZEC is here RAIL$1,180 · today’s low and the channel’s lower trendline 0.382near $1,142 · horizontal floor under the rising channel 0.500around $971-$994 · 0.500 Fib, rising 100-day SMA and the $1,000 mark 0.618near $800 · golden pocket, deep retracement support 200D$734 · 200-day SMA, the long-term trend baseline 0.786near $557 / $247 · deep retracement and the cycle origin at the 1.0 level
The channel’s two exits
The channel has two ways out. Which one ZEC takes is still an open question.
↓ Exit through the floor
If ZEC closes a day below the lower rail around $1,180 and then loses the horizontal floor near $1,142,
then the two-week channel would look like a bear flag capped by the 50-day SMA, and a break under $1,142 could open a faster drop toward the $971–$994 zone, where the 0.500 Fib meets the rising 100-day SMA.
↑ Exit through the ceiling
If buyers build on today’s bounce, backed by 109.7K ZEC of volume, and force a decisive daily close above both the 50-day SMA near $1,310 and the ceiling close to $1,354,
then the bear-flag reading would no longer hold, and the $1,310-$1,354 band could start acting as support. Clearing the upper rail and the broken dashed trendline could open a move back toward $1,500 and a retest of the $1,695 peak.
Safety nets below
Below the channel, support comes in layers. The first has strengthened lately: the red 100-day SMA has climbed to around $994, just under $1,000, and now sits close to the 0.500 Fibonacci level near $971. Under that are the golden pocket near $800 and the purple 200-day SMA at $734, the line that marks the long-term uptrend. The deep 0.786 level near $557 and the June origin near $247 are where the whole run began, and price is still a long way above both.
This story was originally published by Coindoo. Read the original article.


