Zcash Price Hits Its Floor a Third Time: Bear Flag Risk

Key Takeaways
- ZEC bounced off its channel floor today.
- The 50-day SMA has turned lower.
- The 0.236 Fib capped early November’s push.
- RSI is flat, just under 50.
On TradingView’s Binance ZEC/USDT chart at 09:09 UTC, Zcash trades at $1,228, up 1.2% on the day.
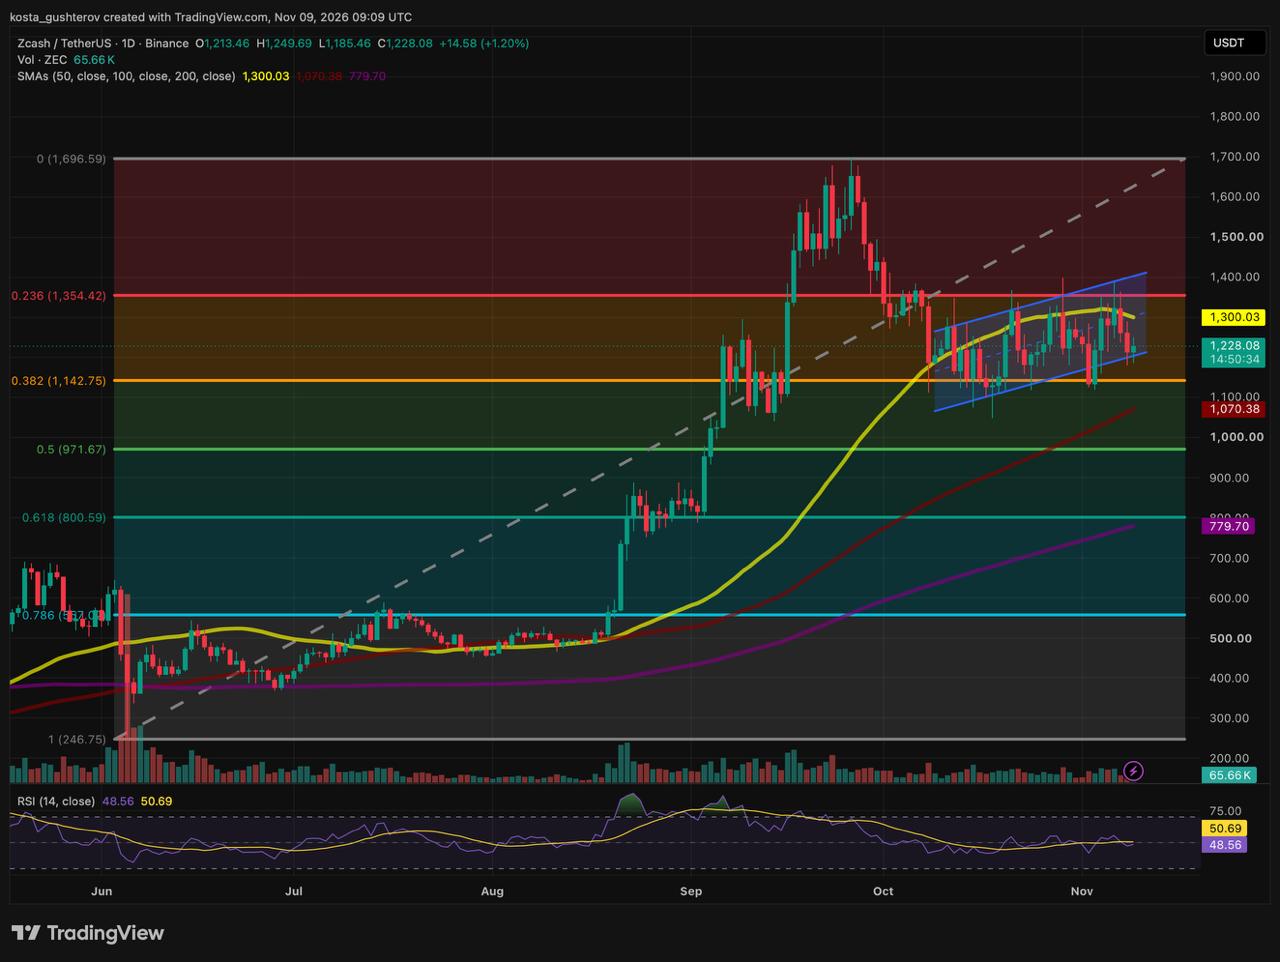
The bounce kept ZEC inside a channel that has carried it since early October, but the room inside is getting smaller. The 50-day SMA has rolled over at $1,300, where the channel’s midline also runs, while the lower rail keeps rising toward it. About $85 now separates the two.
The early-November push stopped at the 0.236
In early November, ZEC climbed back above the 50-day SMA and pushed into the 0.236 Fibonacci retracement near $1,354, measured from the June low near $247 to the September peak near $1,697. It closed above the 50-day for several sessions, but none of those closes cleared the 0.236. Red candles on November 7 and 8 then took it back under the average.
The 50-day SMA rose steadily from ZEC’s mid-August rally until late October. It has since flattened and begun to tip lower, and it now sits on the channel’s dashed midline and the round $1,300 mark. The first resistance above price is three references at one level, not a lone average.
Three tests of the lower rail
Today’s dip below the lower rail was the third time it has been crossed since October. ZEC climbed back inside after the first two, and so far it has done the same today.
Tests of the lower rail since October
Mid-October
A wick to about $1,050, well under the rail, closed back inside the channel
Early November
A daily close under the rail, with a dip below the 0.382 level, reclaimed in the next session
November 9
Opened on the rail at $1,213, wicked to $1,185 and recovered, with a session high of $1,250
What sits under the channel
If the rail fails for good, the first horizontal level is the 0.382 retracement near $1,143, about $42 under today’s low. Below it, the 100-day SMA has climbed to $1,070, above both the 0.500 level near $972 and the $1,000 mark. A month ago that average sat well under $900, so a break of the channel would now run into trend support much sooner than it would have in October.
The 14-day RSI reads 48.56, just under the 50 line and 2.13 points below its signal line at 50.69, after slipping back from above 50 during the two red days.
Two readings of one channel
Buyers can point to a rail that has been reclaimed twice and defended a third time. The bearish case rests on the bigger shape: a rising channel that follows a sharp drop, like the slide from the September peak, is how a bear flag looks, though the pattern only counts once price breaks below it. Neither case is settled while ZEC trades inside the channel.
ZEC sits about $15 above the rail and $72 below the 50-day.
↑
If the rail holds
Holding today’s $1,185 low and closing above the rail, with RSI back over its signal line, keeps the channel intact and could set up another run at $1,250 and the 50-day at $1,300. A daily close above $1,300 and the 0.236 near $1,354 could open the upper rail near $1,400, then $1,500 and the September peak near $1,697.
↓
If the rail gives way
A daily close below the rail and today’s $1,185 low would break the channel and support the bear-flag reading. That could expose the 0.382 near $1,143, then the 100-day at $1,070 and the 0.500 near $972. Further down, the 0.618 near $801 sits next to the 200-day SMA at $780.
The first signal is a daily close outside the $1,213–$1,300 band, and with the rail climbing about $5 a day, that band tightens with every session. Even a slide to the 0.618 and the 200-day would leave ZEC far above the 0.786 near $557 and the June low near $247 that anchor this retracement.
This story was originally published by Coindoo. Read the original article.