Strategy’s 849,327 BTC Sit 2.3% Below Its $75,451 Cost Basis

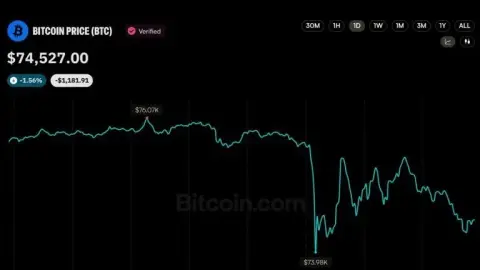
Bitcoin traded at $73,731 at 08:10 UTC on Nov. 9, according to CoinGecko price data. Strategy paid an average of $75,451 for the 849,327 coins it held on Nov. 1. The position is $1,720 per coin underwater, a paper loss of $1.46 billion on a cost base of $64.08 billion, and the daily series broke below that line for the first time since August.
The numbers come from Strategy’s Form 8-K filed Nov. 2, which reports bitcoin holdings and weekly capital flows as of Nov. 1. The filing is two pages of tables. It also fixes the break-even price for 4.22% of the bitcoin in circulation at $75,451, and that level is now above the market.
What changed this week is the price, not the coins. No purchase has been disclosed since Nov. 1; the next weekly update covers Nov. 2 to Nov. 8. Meanwhile the daily series ran $80,443 on Nov. 5, $75,775 on Nov. 7, $75,776 on Nov. 8 and $73,731 on Nov. 9. The last daily reading below $75,451 before this stretch was Aug. 21, at $73,021. Seventy-nine consecutive readings above the line ended in one weekend.
The Gap Is $1,720 a Coin
Reconstruct the arithmetic. The filing gives an aggregate purchase price of $64.08 billion and an average of $75,451, both inclusive of fees and expenses. The aggregate figure is rounded to the nearest $10 million, so dividing it by 849,327 coins returns $75,448 rather than the stated $75,451. Use the company’s own average; the difference is a rounding artifact, not a dispute.
At $73,731 the position is worth $62.62 billion against $64.08 billion paid. Break-even sits 2.33% above the current price. That is close enough to be reached in a session and far enough to have survived 79 of them: bitcoin spent most of September and October above $75,451, peaking at a 90-day high of $86,597 on Sept. 22 and $85,540 on Oct. 7.
Bitcoin is 41.5% below its all-time high of $126,080 and 11.1% lower over 30 days. Against the 90-day range of $62,844 to $86,597, the $75,451 cost line sits 20% above the low and 13% below the high. It is not an extreme level in either direction. It is the line where the treasury’s valuation changes sign.
Last Week’s Coins Cost $80,846 Each
Between Oct. 26 and Nov. 1, Strategy bought 811 bitcoin for $65.5 million, an average of $80,846. That is 9.65% above the Nov. 9 price. The filing states that the purchases “were made using net proceeds from MSTR Stock sales” and footnotes both the aggregate and average figures as “inclusive of fees and expenses.”
This is the mechanical reason the break-even price is sticky. On Oct. 18 the company reported 848,517 coins at an average of $75,446, the latest step in a run of weekly additions that took its treasury past 847,000 coins in late September. It has since added 810 coins, and the average has moved five dollars, to $75,451. Buying at $80,846 does not repair a cost basis built from cheaper coins; it lifts it. Only purchases well below $75,451 pull the number down, and only in size.
The same ratchet works in reverse. If bitcoin holds below the average, each new weekly purchase made at a higher price widens the gap, and each purchase made lower narrows it. The average is a running weighted number, not a target the company can set.
Only 40 Cents of Every New Dollar Went to Bitcoin
The filing also shows where the week’s capital went. Strategy sold 1,178,552 MSTR shares through its at-the-market program for $164.0 million of notional value. Of that, $65.5 million funded bitcoin purchases, or 39.9%. The rest, “$98.5 million in net proceeds from MSTR Stock sales were allocated to USD Cash,” the filing states.
Cash moved out the other way too. The company repurchased 2,092,035 STRC shares for $208.2 million, funded from USD Cash. Set the two against each other and the week’s disclosed allocation was $65.5 million into bitcoin and $208.2 million into retiring a preferred series, a ratio of roughly 1 to 3.2. Across both, $372.2 million was deployed and bitcoin took 17.6% of it.
The filing keeps that choice open rather than committing it. USD Cash is described as capital management maintains “to deploy for broader general Bitcoin Treasury Company purposes, which may include acquiring bitcoin, expanding the USD Reserve, broader capital management uses.” Nothing in the document directs the next dollar to bitcoin, and nothing rules it out.
What the $4.79 Billion Reserve Covers
Strategy runs two dollar buckets. The USD Reserve, defined in the filing as “intended to support the payment of dividends on Strategy’s preferred stock and interest on its outstanding indebtedness,” held $4.79 billion on Nov. 1. USD Cash, the discretionary bucket, held $132.7 million. During the week, $43.4 million of the reserve funded preferred dividends.
The preferred stack pays fixed coupons: 10.00% on STRF, 10.00% on STRD, 8.00% on STRK and a variable rate on STRC, per the 8-K cover page. Those are dollar claims on a treasury whose value moves with bitcoin. At the week’s $43.4 million pace the reserve would cover roughly 110 weeks, though preferred dividends follow a payment calendar and one week is not a reliable run-rate.
Two buyback lines stay open: $748.6 million of aggregate purchase price for preferred stock under the digital credit securities repurchase program, and $1.0 billion for MSTR common. Both compete with bitcoin for the same dollars. In the week reported, both won.
Where $75,451 Sits on the Chart
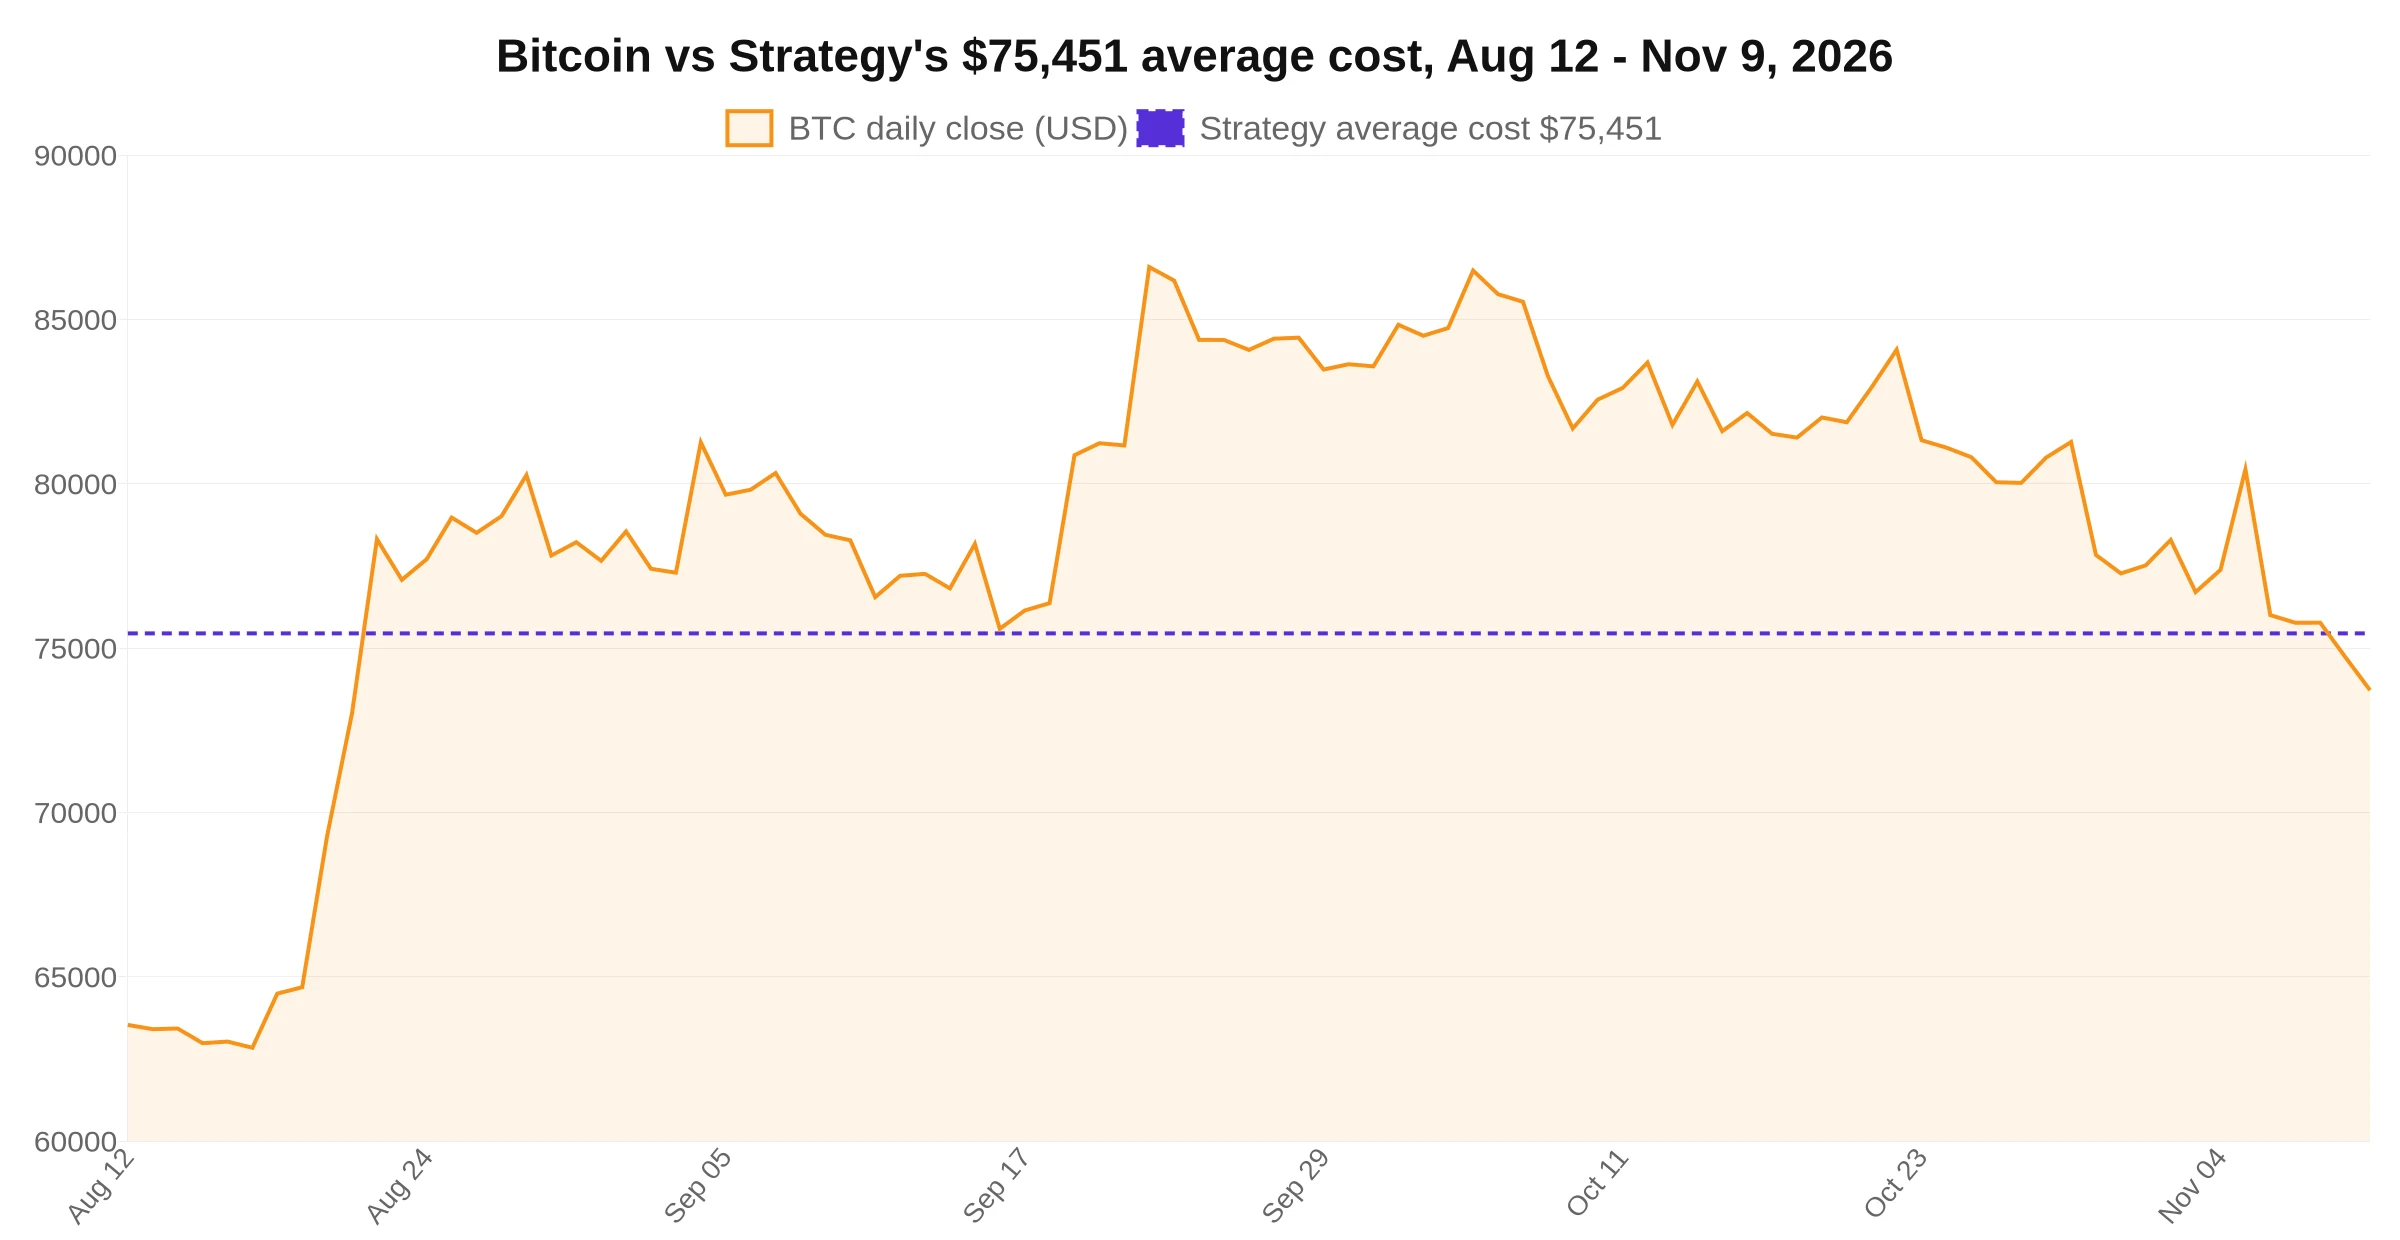
The chart plots 90 days of daily readings against a flat line at $75,451. The pattern is a long September and October stretch above the line, a brief test below in the first days of November, a bounce to $80,443 on Nov. 5 that came on the same session that bitcoin reclaimed $78,000 while US spot ETFs logged a third straight day of outflows, and a second break on Nov. 9. A level that gets tested twice in a week is being contested, not conceded.
Three reference points follow from the arithmetic rather than from forecasting. First, $75,451 is break-even: a daily reading above it restores a paper gain on all 849,327 coins. Second, the Nov. 9 session low, around $73,725, is where buyers last stepped in, per the same CoinGecko series. Third, $80,846 is what the newest 811 coins cost, so a move above it would put the latest tranche in profit while the full position stays under water. Each point is invalidated the moment a new weekly 8-K changes the average.
How Many Coins at $70,000 Would Fix the Average
Run the repair math. To pull the average from $75,451 down to $74,000 by buying at $70,000, Strategy would need to add about 307,450 coins, roughly 36% of its current position, for $21.5 billion. To reach $73,000 at the same purchase price it would need 693,043 coins and $48.5 billion.
Now set that against the disclosed pace. Last week the company put $65.5 million into bitcoin. At that rate, $21.5 billion of buying takes 328 weeks, a little over six years, and bitcoin would have to hold near $70,000 the entire time. The cost basis is a slow number in both directions: expensive to repair through buying, and hard to damage further unless purchases cluster well above the market.
There is a faster route, and it runs through the equity. Every dollar raised by selling MSTR shares above the value of the bitcoin attributable to each share adds coins without adding cost at the same rate. That is the lever the company has used all year. Last week it applied only 39.9% of the proceeds to coins.
The Counter-Case
Three things keep the paper loss in proportion. It is 2.28%, small enough to reverse in a session. The $4.79 billion reserve sits apart from the bitcoin and is not marked against it. And the filing discloses no collateral call, lender demand or forced-sale trigger tied to the price of bitcoin, so a mark-to-market loss on an unmargined asset is a valuation event, not a cash event.
The pressure sits in the capital structure rather than in the coins. Preferred coupons are paid in dollars, and the dollars come from the reserve and from stock sales. When stock is sold to buy bitcoin above the market while cash goes to retiring preferred, the claim per coin changes even when the coin count does not. Common holders carry that mark; preferred holders rank ahead of them for the fixed coupon.
For other treasury companies the reading is narrower than it looks. A 2.3% gap between cost and market is noise for a company that can raise dollars. What matters is whether the funding channel stays open at a price above the coins it buys. Last week the channel was open, $164.0 million wide, and 60.1% of it went to cash.
What to Watch Next
The number to watch is $75,451 on a daily reading, not the intraday print. Above it, the treasury is worth more than the company paid; below it, every weekly purchase at a higher price pushes the line further from the market. The next test arrives with the weekly 8-K covering Nov. 2 to Nov. 8, which will show whether the company bought into the drop, paused, or bought above it again.
Two figures in that filing will settle the question faster than the price: the average purchase price and the split of ATM proceeds between bitcoin and USD Cash. If the average rises while the cash share stays above 60%, the treasury is being managed for liquidity first. If the average falls, the company chose the other side of the trade.
Data: CoinGecko price series, Nov. 9, 2026, 08:10 UTC; Strategy Form 8-K filed Nov. 2, 2026.
This article is not intended as financial advice. Educational purposes only.
This story was originally published by Blockchain Reporter. Read the original article.