Quant Price Squeeze Is Running Out of Room – $214 in Focus

Key Takeaways
- QNT near $204, below 0.5 Fib around $214.
- Rising 50-day SMA ($183) overtook the 0.618 Fib.
- Daily RSI at 53.64 above its signal line.
- Late-October dip held above the first low.
QNT is still working through the spike that followed The Clearing House’s September 24 announcement that it had selected Quant’s technology for its On-Chain Money Initiative, a planned network for clearing and settling tokenized bank deposits.
On Binance’s daily chart, QNT is up 1.32% on the day, about $3, after opening near $202 and trading between roughly $197 and $206. The session dipped below $200 and recovered, keeping price on the round number buyers have defended through the recent sessions.
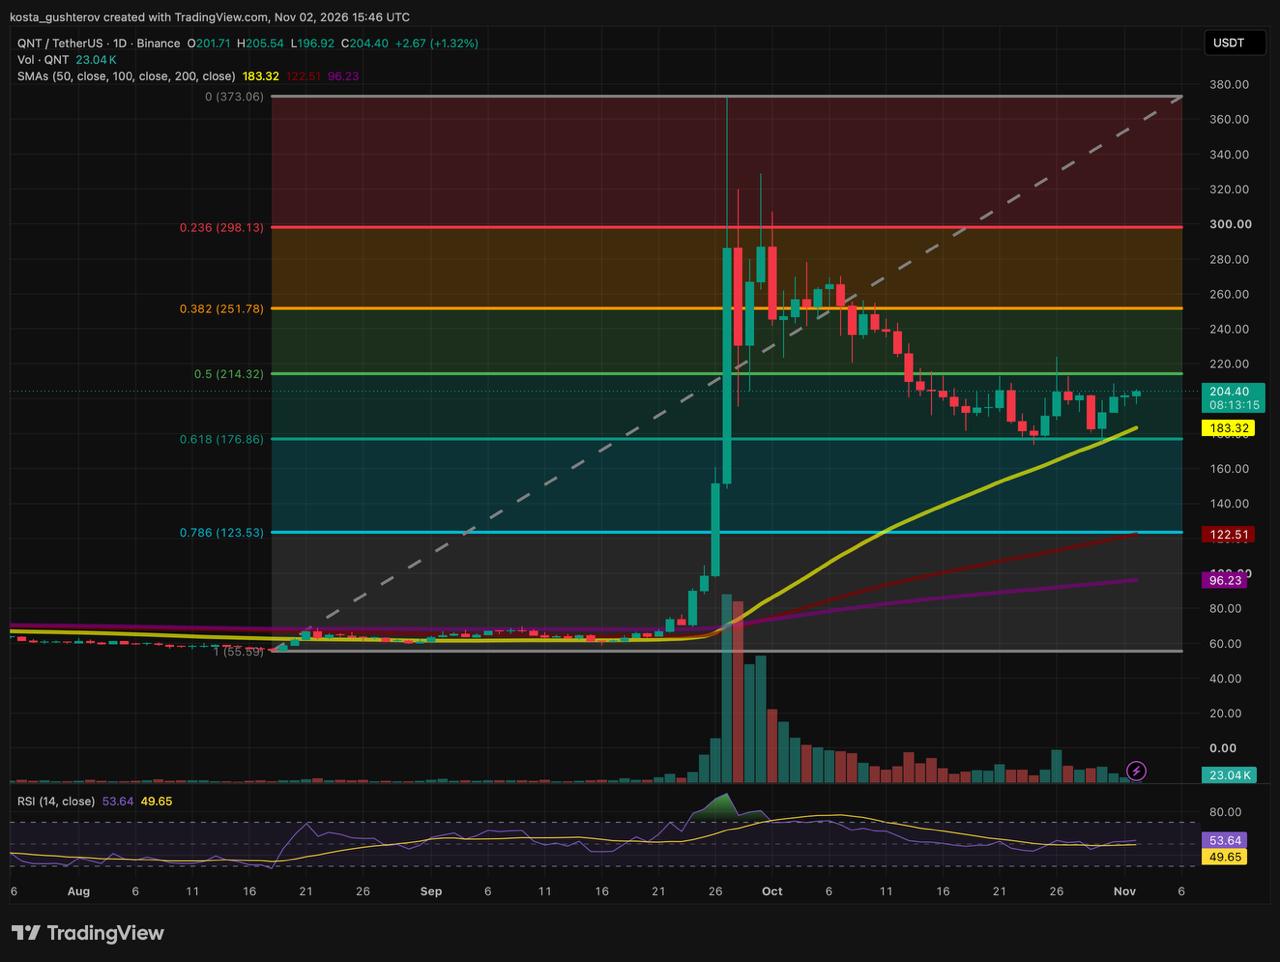
The more telling figure sits underneath the price. Eight days ago, the 50-day simple moving average was around $162, about $15 below the 0.618 Fibonacci retracement near $177. It now reads $183, roughly $6 above that level. The trend line has climbed through the horizontal floor in little more than a week.
That changes where support starts. During the first test of the 0.618 level, the nearest floor was a flat Fibonacci line. Now a rising average sits above it, so dip buyers have a higher level to defend. The space between that line and the 0.5 retracement around $214 is narrowing from below while the ceiling stays flat.
Two Dips, Two Different Lows
QNT first dropped to the 0.618 level near $177 around October 25. The bounce carried it into the 0.5 retracement around $214, where price pushed above the level intraday but could not close there, and sellers drove it back down.
The second pullback, at the end of October, did not return to $177. It stopped higher, close to the rising 50-day average, and a strong green candle lifted price back toward $200. A higher low under a flat ceiling is a constructive shape, but it is not a confirmed double bottom. That would need the second low to match the first and a close above the high between them.
Momentum has shifted in the same direction. The 14-day RSI reads 53.64, above its signal line at 49.65 and back over the 50 midline after most of October below it. A reading in the low 50s points to a modest change in momentum, not a strong one.
What Sits Above $214
The 0.5 retracement around $214 is the midpoint of the entire August-to-September move, and it has already turned one rally back. It sits about $10, or 4.85%, above the current price.
A close above it would not lead into empty space. QNT traded for several sessions in early October between that midpoint and the 0.382 retracement near $252 before breaking down. Holders who bought in that band could use any return to it as a chance to exit near break-even.

How a 10 ETH Refund Bug Froze THORChain Trading on 10 Chains
The Wider Map Still Leans Up
The Fibonacci grid is drawn from the August low near $56 to the late-September peak near $373. Above the 0.382 level, the 0.236 retracement near $298 marks the area where QNT traded in the days after that spike.
Further down, the 100-day SMA has climbed until it almost meets the 0.786 retracement, and the 200-day SMA at $96 is still sloping upward. The 50-day sits above the 100-day, which sits above the 200-day, so the averages remain in bullish order even after QNT gave back more than half of the September move.
The Squeeze May Have a Time Limit
The 50-day average gained about $21 in eight sessions, close to $2.70 a day. At that pace, the line would reach the current price in roughly eight more sessions.
The pace comes from how the average is built. Each day it adds the latest close and drops the one from 50 sessions earlier. For now, it is dropping closes from mid-September, when QNT still traded near the bottom of the Fibonacci grid, and replacing them with closes around $200. That swap is what lifts the line so quickly.
But it looks like the effect has an expiry date. Around mid-November, the closes rolling out of the average become the late-September spike sessions, most of them well above today’s price. From that point, the 50-day stops climbing at this rate, and it would start to flatten or dip if QNT is still trading near $200. The rising floor that is squeezing price toward $214 has roughly two weeks of push left, so the range has a limited window to resolve.
If buyers clear the midpoint
What it needs
Daily closes that stay above $200 and the 50-day SMA at $183, with the RSI cross above its signal line backing a push into the 0.5 level.
The trigger
A decisive daily close above the 0.5 retracement around $214, which would confirm the reversal off the 0.618 area.
Where it could lead
The 0.382 retracement near $252, roughly 23% above current levels, through the band where QNT traded in early October.
If the midpoint turns it back again
What it needs
Another failure at the 0.5 level on thin volume, followed by a slip below today’s low near $197.
First stops
The rising 50-day SMA at $183, then the 0.618 retracement near $177.
What breaks the base
Only a decisive daily close under the 0.618 level near $177. That would expose the $123 to $124 zone, where the 100-day SMA at $123 meets the 0.786 Fib near $124.
What could undercut both readings
The September rally was news-driven. The Clearing House release describes Quant’s technology and does not mention the QNT token, and it says the network is expected to open to participating institutions in the first half of 2027. Any rerating of the token on that deal still has no live usage behind it.
Today’s volume of about 23,000 QNT comes from a session that has not closed yet, so whether buyers are pressing the ceiling with conviction can only be judged from completed daily candles.
This story was originally published by Coindoo. Read the original article.