HYPE Price Escapes One Trap, Walks Into Another

Key Takeaways
- HYPE has left its late-October downtrend channel
- Two key resistance levels overlap near $70
- Momentum still leans toward sellers
- Team token unlocks begin November 29
The slide has hit a token that public companies have been accumulating: Hyperliquid Strategies (Nasdaq: PURR) reported spending $785 million on 9.1 million HYPE between July and September, lifting its treasury to 38.5 million tokens.
How HYPE Got Here
HYPE’s decline began in late October and followed a steep descending channel, a downward-sloping corridor formed by two parallel lines that contained almost every daily candle for the next three weeks. The heaviest trading volume of the period came at the start of that slide and again in mid-November, when sellers were most active.
The mid-November leg did the most damage. It pushed HYPE below its 200-day simple moving average (SMA), the average closing price of the past 200 days and a line many traders treat as the boundary between a healthy and a weakening trend. Until then, HYPE had stayed above that average for months. The same sell-off dragged the 14-day Relative Strength Index (RSI), a momentum gauge running from 0 to 100, down toward the 30 mark that traders read as oversold.
The Rebound So Far
Since that low, HYPE has climbed out of the channel. On the daily chart it trades around $69, above the corridor’s upper line, which shows sellers can no longer push the price down at the pace they managed earlier in the month.
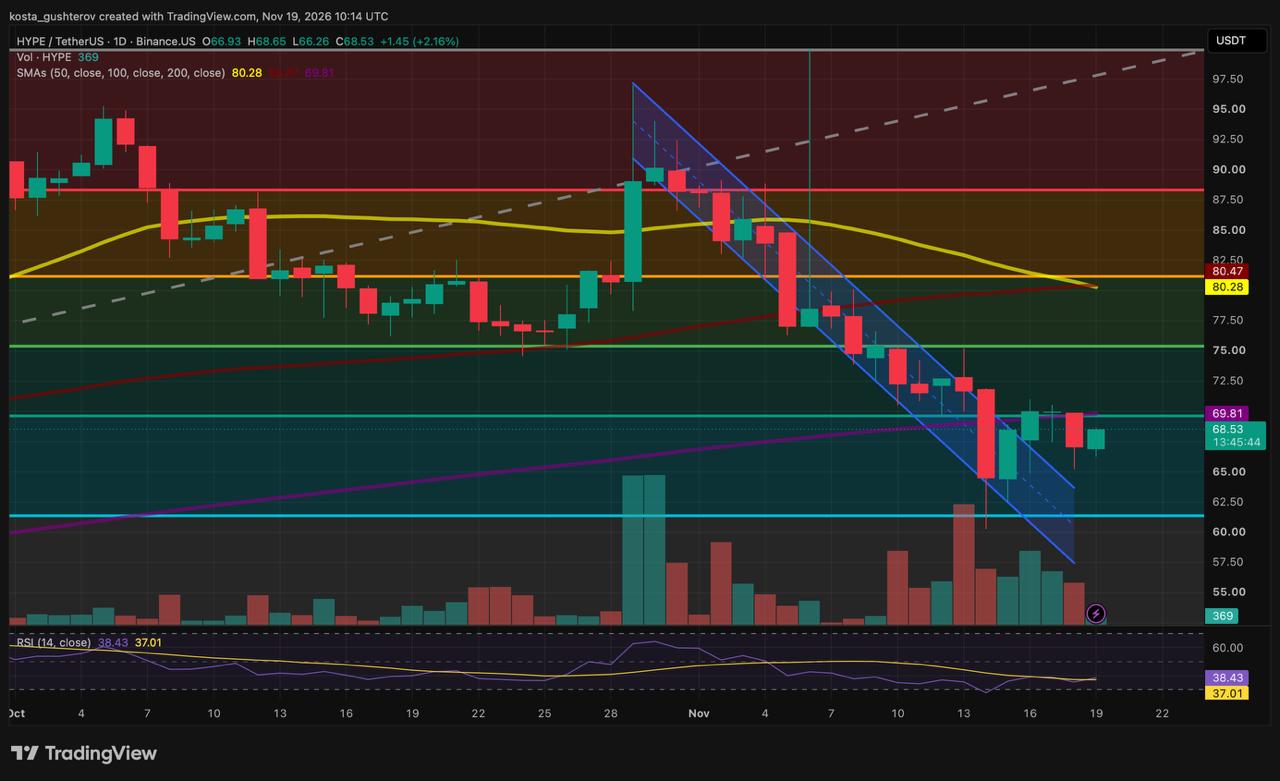
The bounce has been cautious, though. RSI has recovered to about 38, only slightly above its signal line near 37 and still well short of the 50 mark associated with buyers taking control. Daily volume of 369 HYPE on this Binance.US feed is light compared with the heavy selling days of late October and mid-November.
Why the Rally Stalls Just Below $70
Traders often map pullbacks with Fibonacci retracement levels, horizontal lines drawn at set percentages between a major low and high. Measured from HYPE’s late-July swing low to the spike high near $100 on this chart, the 0.618 retracement, one of the most closely watched, sits close to $70.
The 200-day SMA also runs at about $70, within a fraction of a dollar of that Fibonacci level. Before mid-November, this zone acted as a floor under HYPE. Now price is testing it from below, the position in which old support often turns into resistance. The last few sessions show that contest: one candle’s high poked above the zone, the next closed back near $67, and today’s session bounced from a low around $66.
What the Next Daily Close Would Signal
A single intraday spike in either direction says little. A daily close on either side of the $70 zone carries more weight.
If buyers break through
A decisive daily close above $70 would put HYPE back over both the 0.618 level and the 200-day SMA. If the zone then holds as support on a retest, the channel escape would become a reversal setup, with room opening toward the 0.5 Fibonacci level around $75.
If sellers hold the line
A push into the $70 zone followed by a close back below it would confirm the area has flipped to resistance. HYPE would then risk sliding back toward or inside the channel, with the 0.786 Fibonacci level near $61 in view, an area the mid-November low briefly dipped under.
Bigger Hurdles Further Up
Even a clean break above $70 leaves heavier resistance overhead. The 50-day SMA has been falling since early November and now sits just under the 100-day SMA, with both near $80 on the live candle. A daily close at those readings would confirm that the faster average has crossed below the slower one, a shift traders read as medium-term weakness.
The supply calendar adds another factor. FalconX research notes that HYPE’s first team token unlocks begin on November 29, bringing newly released tokens to market while price is still working through these levels.
This story was originally published by Coindoo. Read the original article.