Crypto’s Q3 Rally Hid a Massive Revenue Slump

Beneath the surface, however, onchain fee generation told a fragmented story: Ethereum’s base-layer fee revenue collapsed to multi-quarter lows, Solana’s surge in transactional volume generated minimal protocol cash flow, and Bitcoin’s profitability rebound proved to be an accounting byproduct of price appreciation rather than an influx of fresh capital.
Key Takeaways
- Bitcoin’s NUPL spike tracked price, not fresh capital.
- Ethereum fees tumbled 31% despite a 71% rally.
- Solana’s quarterly fee pace eclipsed its trailing year.
- Solana holders remain 7.4% underwater despite record throughput.
The figures come from Fidelity Digital Assets’ Q4 Signals Report, published October 28 with data through September 30.
Bitcoin
+43%
Q3 price
NUPL 0.09 → 0.36
Ethereum
+71%
Q3 price
Annual fees −31%
Solana
+61%
Q3 price
Q3 fee pace $224M a year
Bitcoin’s profit recovery is mostly the rally restated
Fidelity’s headline profitability metric for Bitcoin is Net Unrealized Profit/Loss (NUPL), which climbed from 0.09 to 0.36 during the quarter. As formulated by Glassnode, NUPL divides the difference between market capitalization and realized capitalization by total market capitalization. Realized capitalization prices each coin at the time it last moved onchain, establishing an aggregate cost basis for the network. A reading of 0.36 indicates that aggregate paper gains account for 36% of market value; it does not mean that 36% of active wallets or investors sit in profit.
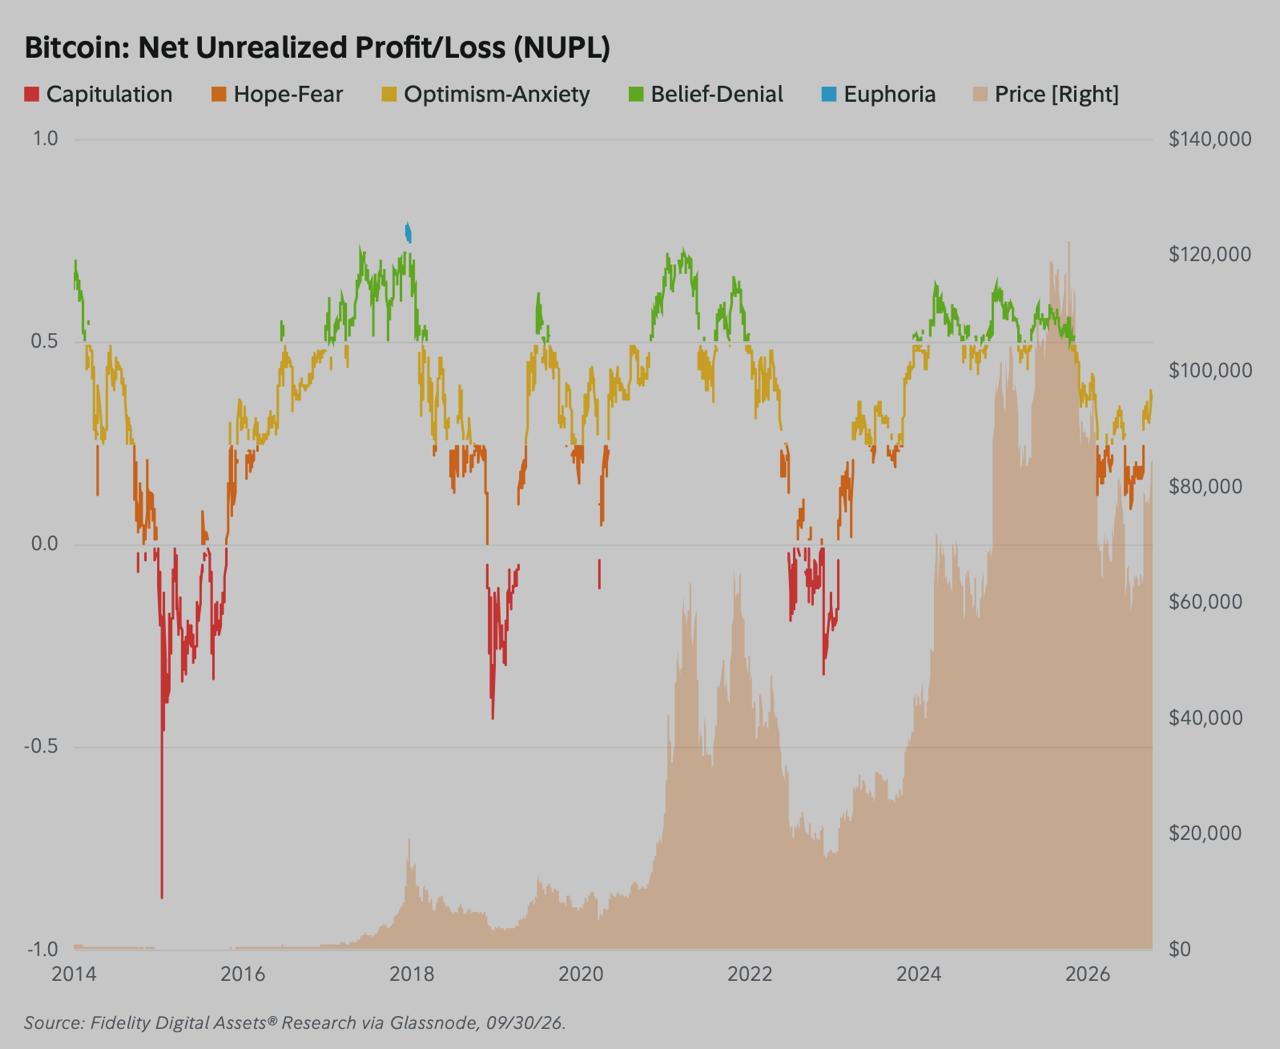
Because the prevailing spot price sits directly inside both the numerator and denominator of that equation, a market-wide rally mechanically elevates NUPL on its own. At the start of Q3, an initial NUPL reading of 0.09 meant the network’s realized cost basis stood at roughly 91% of its total market cap (1 − 0.09 = 0.91). If that aggregate cost basis is held unchanged while Bitcoin’s 43% quarterly price gain is applied to market value, the sensitivity formula proves that no substantial new capital was required to move the needle:
1 − (0.91 ÷ 1.43) ≈ 0.36
Coindoo’s sensitivity calculation using Fidelity’s rounded inputs
The calculation lands directly on Fidelity’s reported endpoint. While this sensitivity check cannot track individual wallet turnover, it shows that the apparent improvement in Bitcoin’s profitability was largely an arithmetic consequence of the rally itself. One data point in the report reveals an internal tension: Fidelity also reports that Bitcoin trades 45% above its aggregate cost basis, which under the standard formula implies a NUPL closer to 0.31, whereas a 0.36 reading corresponds to trading roughly 56% above cost basis. Regardless of minor methodological divergences, the fundamental takeaway stands: Bitcoin’s profitability signal merely shadowed its price, while broader market participation remained muted.
Ethereum got richer while its fees shrank
Ether posted the strongest performance of the three assets, rallying 71% and driving its NUPL out of deep negative territory (−0.43) back into positive ground (0.16). Yet the cash flow sustaining the underlying protocol deteriorated. According to Fidelity’s full report, rolling 12-month network fees dropped 31%, sliding from $294 million to $204 million. It earned network fees a “Negative” rating – the only such designation across Fidelity’s entire report. Daily fees averaged just $384,000 during the period, oscillating between $133,000 and $1.5 million.
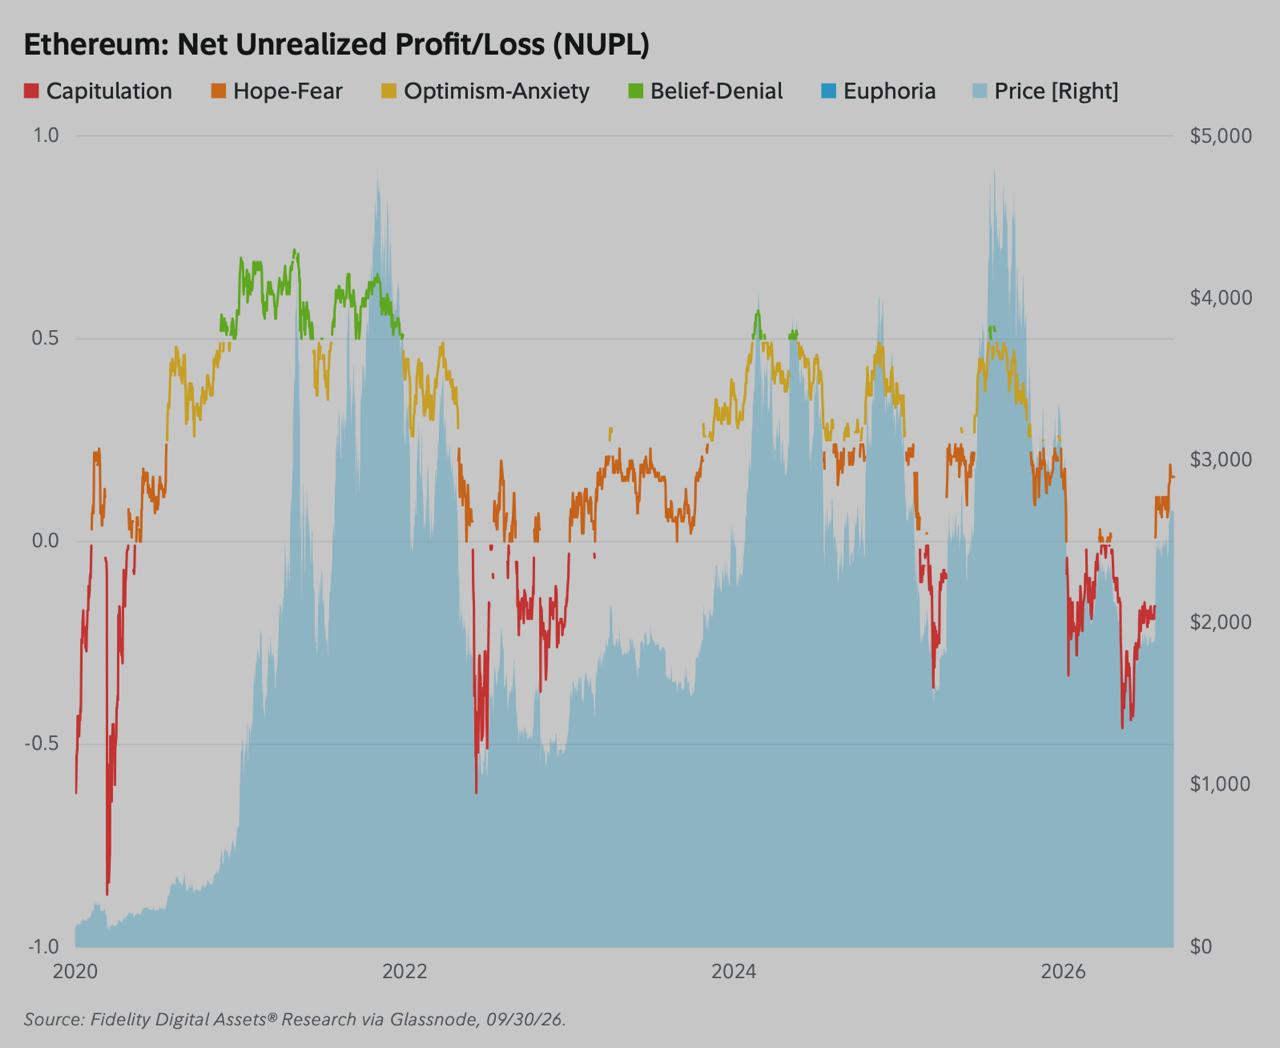
Underlying mainnet usage contracted alongside revenue. Ethereum’s 30-day average transaction count slipped 10% to fall below two million daily, and total active addresses declined 6%. Economically relevant addresses rose 30%, suggesting that while retail transactions left the base layer, high-value institutional settlement persisted. Fidelity’s diagnosis of this divergence was unsparing: the substantial increase in base-layer blockspace over the trailing year has yet to produce a proportional increase in economic demand. The pending Glamsterdam upgrade, slated to expand throughput further, will introduce more capacity into an already oversupplied mainnet execution market.
This decoupling is the direct consequence of Ethereum’s modular scaling architecture. Modern rollups execute transactions off-chain and post compressed data batches back to Layer 1, driving down user costs but systematically stripping fee revenue from the base layer. For ETH holders, this architectural shift carries profound economic trade-offs. Depressed base fees reduce the volume of ETH permanently removed from circulation under EIP-1559, turning the asset net-inflationary during the quarter. At the same time, this revenue contraction directly degrades what staking returns actually deliver, as validator yields compress toward bare issuance rewards in the absence of meaningful priority tips.
Stablecoin activity reflected this migration away from Layer 1. Average daily stablecoin settlements on Ethereum fell to $37 billion during the final 30 days of the quarter, marking a 45% drop from the $67 billion daily average recorded in the first month as volume continued shifting toward cheaper execution environments.

Who Earns the Interest on Your USDC?
Solana’s fees are turning before the trailing number shows it
Solana presented the clearest evidence of operational expansion. Monthly transactions climbed 23% to reach record highs, active addresses expanded 53%, new addresses grew 50%, and economically relevant addresses surged 58%. While low-fee blockchains are inherently prone to automated wallet spam – a measurement distortion that Coin Metrics emphasizes in its address methodology – the 58% jump in economically relevant addresses suggests authentic user growth rather than mere network noise.
Solana’s headline revenue figure masks this intraday turnaround. Trailing 12-month fees dropped 13% to $193 million, primarily because the rolling window discarded the network’s high-activity historical peaks as it incorporated newer data. Looking at the quarter in isolation reveals a pronounced acceleration: daily fee capture averaged $922,000, which annualizes to a run rate of roughly $224 million. That pace comfortably surpasses the trailing-year figure, leading Fidelity to conclude that Solana’s protracted fee decline is finally carving out a durable floor.
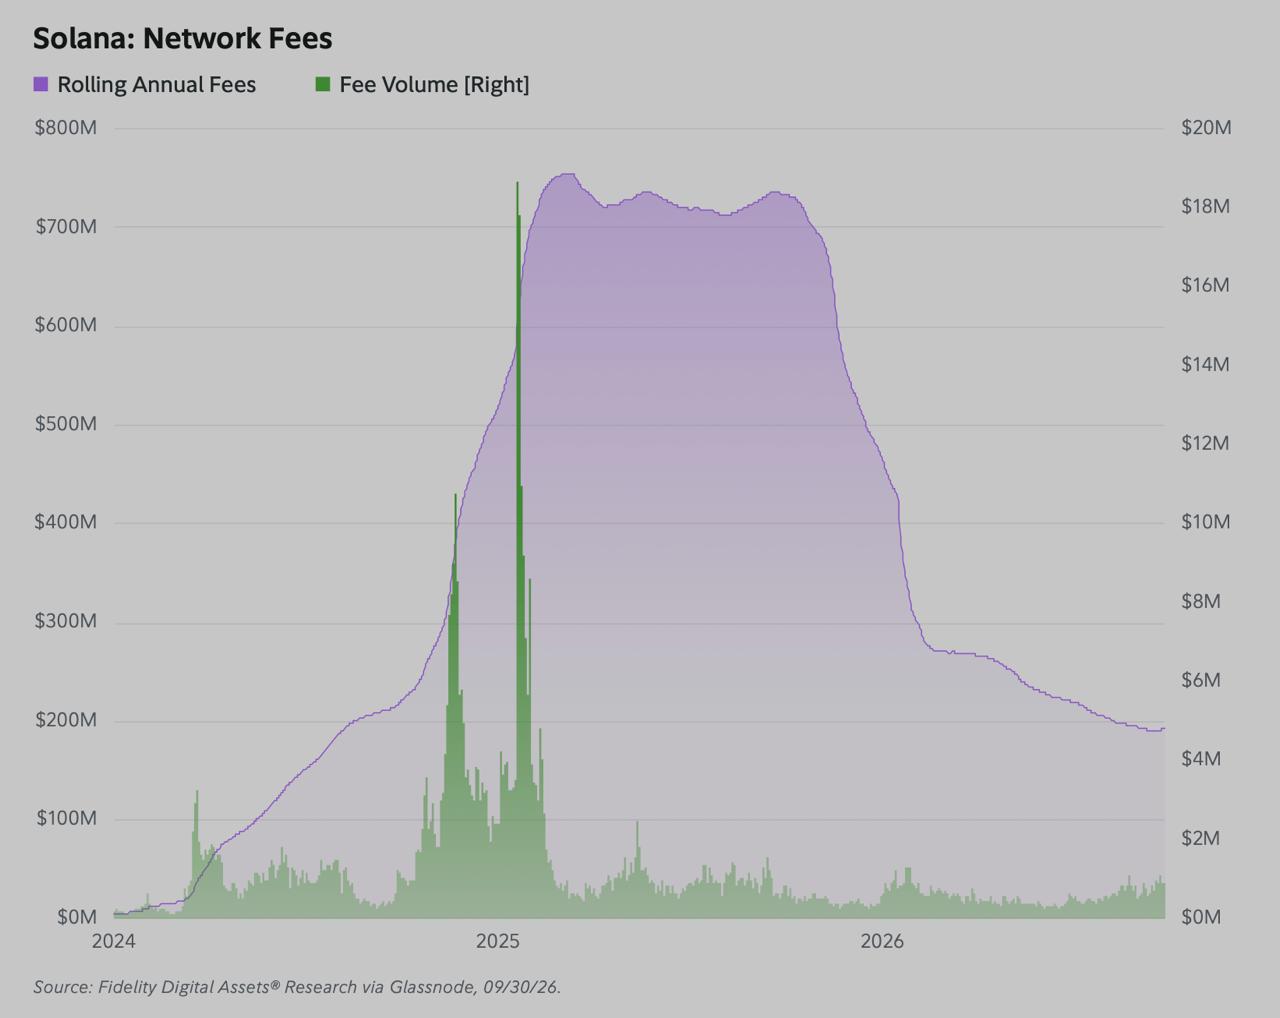
Stablecoin velocity accelerated along with transaction counts. Solana processed more than $10 billion per day in stablecoin transfers, up 20% from the second quarter, compressing the volume deficit between Solana and Ethereum to $26 billion (down from nearly $60 billion earlier in the year). Concurrently, Solana’s native stablecoin supply expanded by 9% ($1.37 billion), far outpacing the wider stablecoin market’s modest 0.5% growth.
Yet this operational momentum has not fully repaired investor balance sheets. Solana’s NUPL recovered from −0.73 to −0.08, but that still leaves the average SOL token roughly 7.4% below its aggregate cost basis, representing approximately $5.5 billion in unrealized losses across the network. Raw throughput has outpaced capital recovery, underscoring the ongoing comparison between Solana’s user counts and Ethereum’s financial depth: handling high-velocity transactions does not automatically translate into institutional balance sheet value.
Moving money isn’t earning money
Aggregate transfer volumes demonstrate how much capital is in motion, not how effectively a protocol captures revenue from that movement. Fidelity notes that estimated stablecoin transfer fees on Ethereum remained below $1 for four consecutive quarters, while Solana’s median transaction fee consistently stayed under a tenth of a cent. Under these conditions, billions of dollars in liquidity can cycle across either chain with negligible impact on protocol earnings. How much of that economic activity ultimately accrues to token holders depends entirely on the design of the fee capture engine:
Bitcoin → All transaction fees go directly to miners on top of programmatic block subsidies, serving purely as an operational incentive rather than a token-accrual mechanism. Developer guide
Ethereum → The base fee is permanently burned to reduce circulating ETH supply, while priority tips compensate block-proposing validators. Ethereum docs
Solana → Fifty percent of the base fee is burned while the remaining half goes to validators; priority fees pass entirely to block producers. Solana docs
Across all three networks, onchain activity reaches token holders indirectly – through mining security, validator staking yield, or supply reduction – rather than through direct dividend-like equity distributions. When transaction fees collapse or remain pinned at sub-cent fractions, those value-accrual channels quickly dry up.
Bitcoin’s miners earn more for a different reason
Bitcoin’s fundamental investment thesis has long centered on long-term holding rather than high-frequency transactional throughput, meaning sluggish fee generation carries fewer existential implications for the asset. However, the latest mining data reveals how operator revenues can expand even as onchain fee generation stagnates. Rather than relying on users spending more satoshis to transact, miners benefited from supply-side compute rationalization.
Following Bitcoin’s correction from its late-2025 peak, several major mining operators pivoted power infrastructure and high-performance computing assets away from SHA-256 hashing toward hosting artificial intelligence workloads. As a result, network hash rate dropped 9% year-over-year. With competitive pressure easing, hash price – the expected revenue generated per unit of computing power – jumped 25%. Consequently, miners captured approximately 22% more revenue than they did during the previous halving cycle, despite operating under a block subsidy that was twice as large. The improvement in miner margins stemmed from a drop in domestic competition, not from organic transaction demand.
Three networks, three answers
The third quarter delivered identical price tailwinds to the market’s three major tokens, but revealed three sharply diverging fundamental profiles. Bitcoin’s surge in paper profitability mirrored its price action with near-mathematical precision, while its mining economy leaned on an AI compute pivot rather than blockspace demand. Ethereum’s market capitalization expanded even as its base-layer annual fee revenue shrank 31% to $204 million under the weight of rollup migration. Meanwhile, Solana established a $224 million annualized fee run rate on record user throughput, yet its persistent sub-cent fee model has left the network’s token holders over 7% underwater.
This story was originally published by Coindoo. Read the original article.