Bitcoin Price Reaches the $76K Shelf It Built in September

Key Takeaways
- BTC tagged $76,500, just above key support.
- 0.382 Fib, 100-day SMA, September low converge.
- Daily RSI at 33.07, lowest since June-July.
- Below $76,066, the 200-day SMA is next.
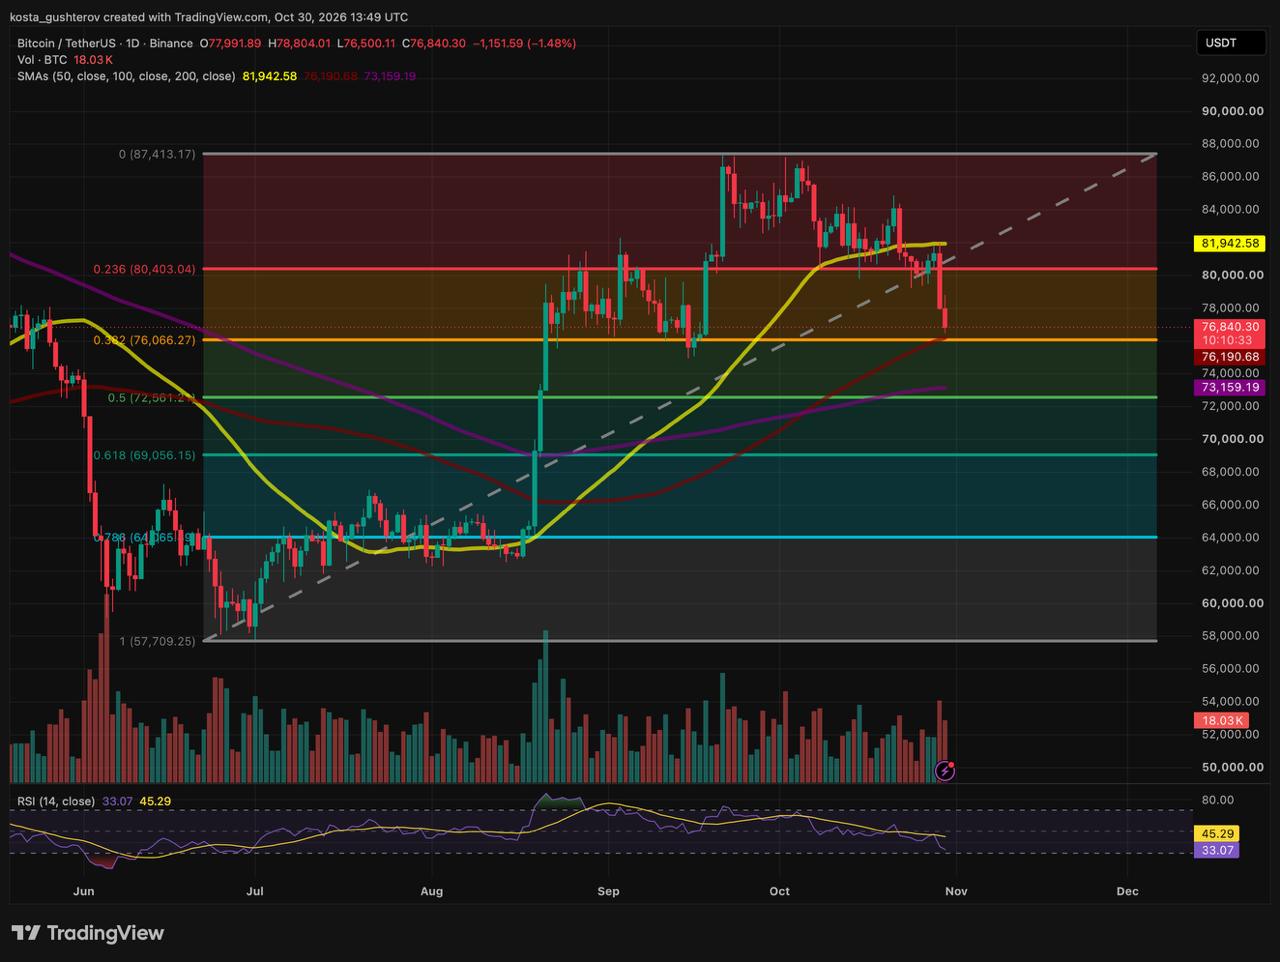
BTC traded at $76,840, down 1.48%, or $1,150, on the day, according to the Binance BTC/USDT daily chart.
How Bitcoin got here
The slide started earlier this week, when Bitcoin lost both its 50-day simple moving average at $81,942 and the 0.236 Fibonacci level at $80,403.04, ending a stretch in which it had been holding quietly around $80,000. Sellers then pushed a two-day expansion move into the mid-$76,000s as the Binance hack unfolded.
On today’s candle:
Open $77,991
→
High $78,804
→
Low $76,500
→
Now $76,840
A brief push higher was turned back, and price fell to a low about $300 above the 100-day SMA, on 18.03K BTC of volume so far.
Three layers of support at $76K
That low stopped just above three supports packed into a band of about $125:
100-day SMA · $76,190
A rising average many trend-following traders watch once the 50-day gives way
0.382 Fibonacci · $76,066
The 38.2% retracement of the move from the July base to the cycle peak
September low · ~$76,066
The floor of mid-September’s consolidation before the breakout to around $87,400
The September low is what makes this more than a calculated level. The $76,066 line held as the exact floor of Bitcoin’s mid-September consolidation, and this is the first time price has returned to it in more than five weeks.
The RSI is stretched
0 · oversold below 3050overbought above 70 · 100
RSI 33.07
Signal line 45.29
The 14-day RSI sits at 33.07, 12.22 points under its yellow signal line at 45.29. The last time it was in the 30 to 33 band was the June-July capitulation base near $57,700. Reaching that level while price still holds support suggests much of the selling pressure has already been spent, though short-term momentum remains with sellers.
What the chart adds up to
Our read is that the drop from the 50-day SMA to today’s low is the mean-reversion leg that followed the loss of that average. Price now sits on the densest support cluster above the 200-day, with RSI near the levels of the summer low. Sellers still hold the momentum; the case for buyers rests on that combination of stacked support and a stretched RSI.
Bitcoin’s price ruler
The Fibonacci grid runs from the $57,700 July base (the 1.0 level) to the $87,400 cycle peak (the 0 level).
$87,400Cycle peak, 0 Fib, set by the twin highs of late September and October $81,94350-day SMA ($81,942), the main dynamic breakdown point $80,4030.236 Fib ($80,403) with the psychological $80,000 above it, now a flipped barrier $78,804Today’s high ($78,804), the first micro-level for buyers to clear $76,840Bitcoin now $76,191Confluence floor under test: 100-day SMA, 0.382 Fib and September low $73,159200-day SMA ($73,159.19), paired with the 0.500 Fib ($72,561) as the deep trend floor $69,0560.618 Fib golden pocket ($69,056), major cycle retracement support $64,0650.786 Fib ($64,065.19), the late-summer consolidation ceiling $57,709Cycle origin, 1.0 Fib ($57,700), foundation of the multi-month advance
Two ways the $76K test could end
These are conditions to watch on the daily close, not calls on which one comes.
HOLDS
Buyers defend the cluster on a daily closing basis, helped by the stretched 33.07 RSI reading.
Holding above $76,000 would set up a relief bounce toward today’s $78,804 high, then a retest of the broken $80,000–$80,403 ceiling from below. Bitcoin would need to reclaim $80,403 before the 50-day SMA comes back into play.
BREAKS
Selling, with 18.03K BTC traded so far this session, overwhelms bids at $76,066 and Bitcoin closes the day beneath both the 0.382 Fib and the 100-day SMA.
Losing the mid-September floor would undo the shallow-correction case and could open a move to the 200-day SMA at $73,159 and the 0.500 Fibonacci midpoint at $72,561.21, roughly another 5% lower, where the next layer of support sits.
How deep the floor runs
Below that 200-day band, the 0.618 Fib at $69,056.15 and the 0.786 Fib at $64,065.19 are the deeper supports, with the $57,700 July base underneath it all. A move to the 200-day would still leave most of the summer advance in place; a close below the golden pocket would mean more than 61.8% of it had been given back.
This story was originally published by Coindoo. Read the original article.