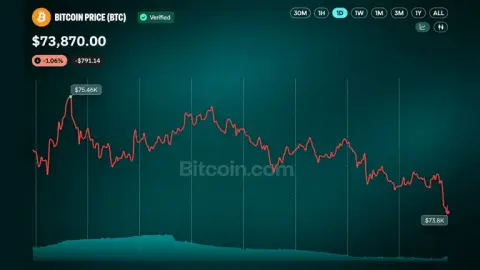
Bitcoin Price Dips Under $74,000 as CPI Prints 0.4%: Key Levels

Key Takeaways
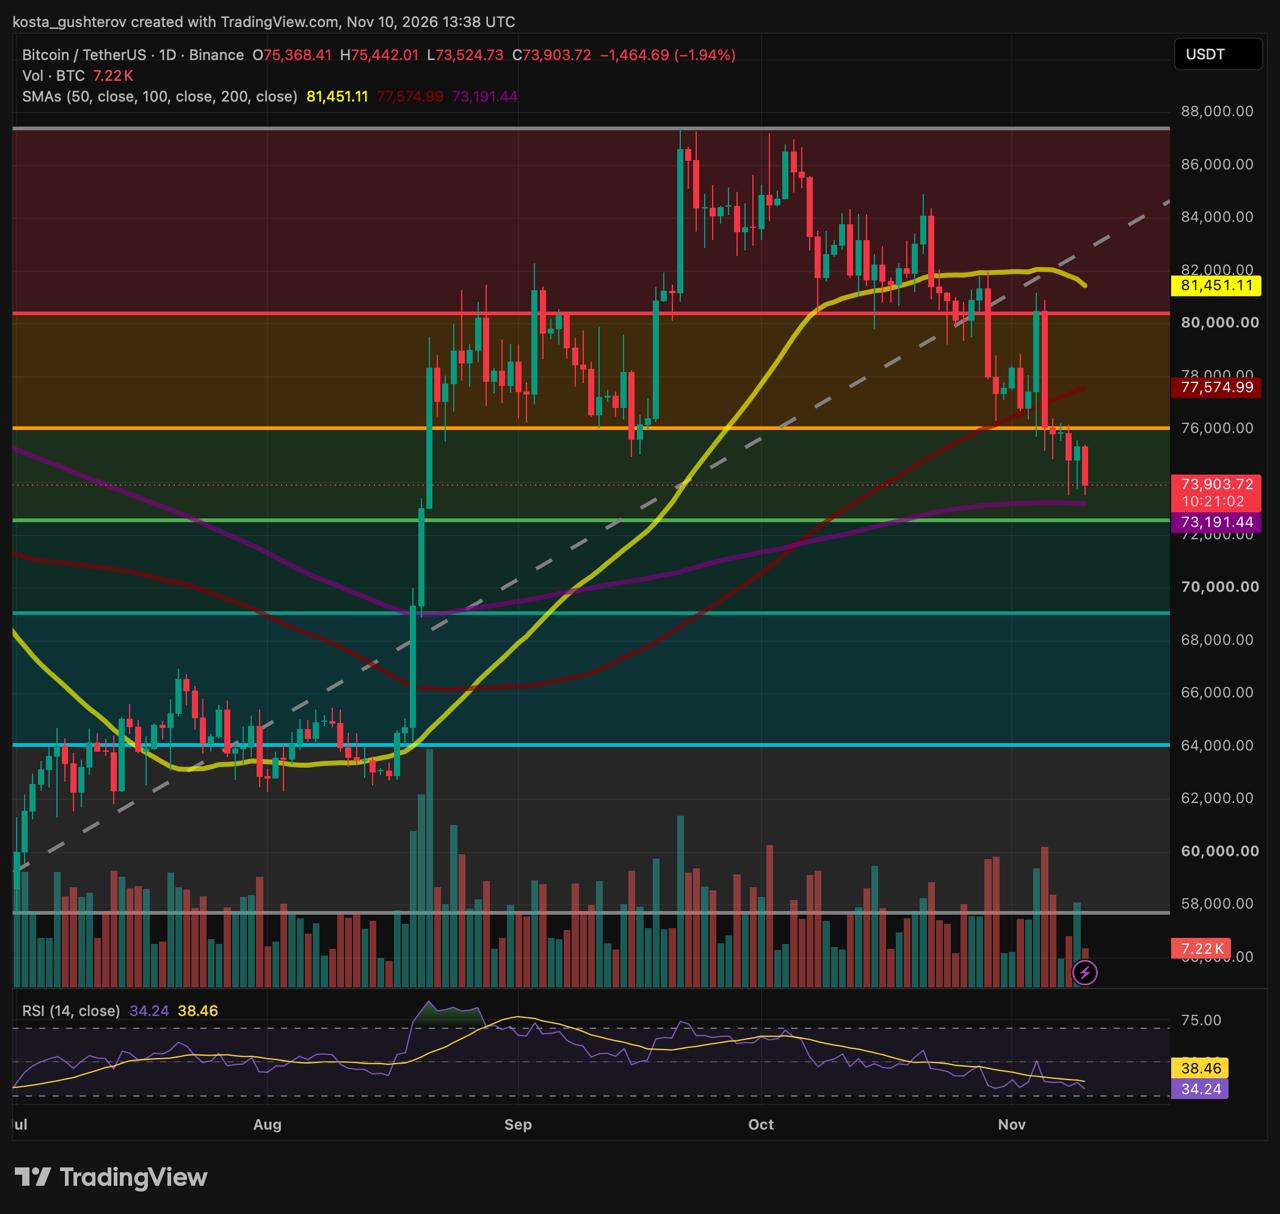
- BTC/USDT down 1.94% at $73,904 on Binance daily.
- Intraday low $73,525, 200-day SMA at $73,191.
- October CPI up 0.4%, core up 0.3%.
- Daily RSI at 34.24, below its 38.46 signal.
The Bureau of Labor Statistics reported that the Consumer Price Index rose 0.4% in October on a seasonally adjusted basis, after a 0.6% increase in September, with the index excluding food and energy up 0.3%.
The number that matters is the one that didn’t move
The headline figure cooled from September, but the part of the report the Federal Reserve watches most closely did not. Core inflation, which strips out food and energy, printed 0.3% in October, exactly as it did in September and August. Three months at that pace work out to roughly 3.7% a year, close to double the Fed’s 2% target, and the stability of the number is itself the message: nothing in October suggests the underlying rate is slowing.
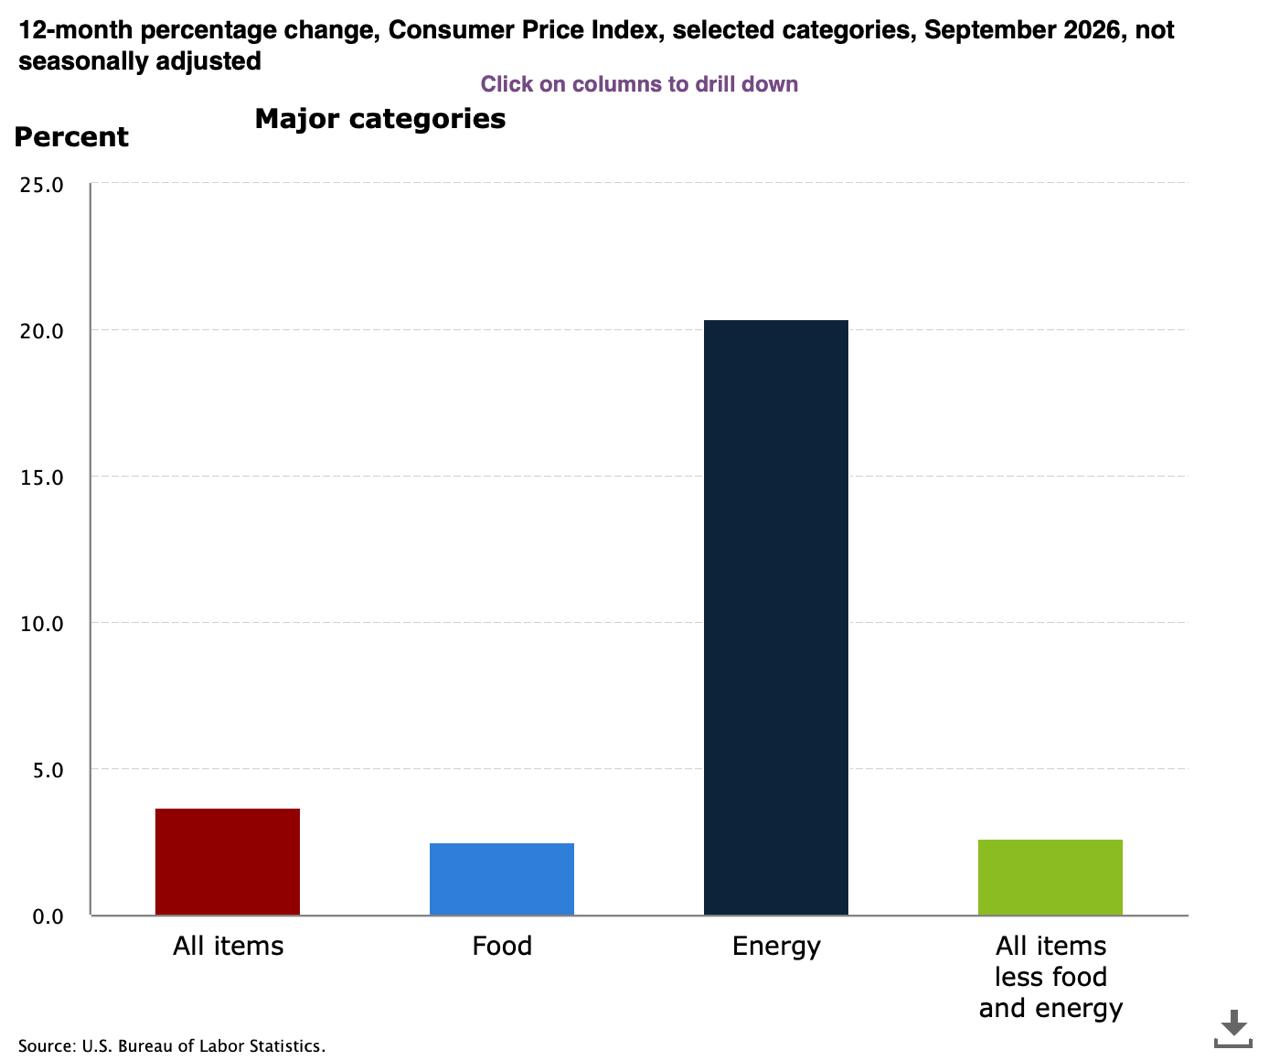
Shelter did most of the lifting. It rose 0.3% and accounted for more than thirty percent of the monthly increase, with owners’ equivalent rent up 0.3% and rent up 0.2%. Food climbed 0.5%, its sharpest monthly rise since April, driven by a 0.9% jump in beef and a 1.0% rise in snacks. Energy added 0.7% after September’s 5.2% surge, and gasoline is up 37.4% over twelve months on an unadjusted basis. The few declines came from used cars, down 1.2%, and communication services.
One figure is absent. The BLS collected no data in October 2025 during last year’s lapse in appropriations, so it cannot publish a twelve-month change for the all-items index this month. Traders who usually anchor on the annual rate were left with the monthly sequence alone: 0.4%, 0.6%, 0.4% for headline and 0.3%, 0.3%, 0.3% for core.
Why bitcoin took it badly
A report that keeps core inflation stuck at 0.3% a month is a report that gives the Fed no reason to ease faster, and bitcoin has spent this cycle trading as a bet on cheaper money. That was the macro backdrop at 8:30 ET. The chart, though, was already in trouble before the release, and the inflation print landed on a market that had failed the same level three days running.
Three failed sessions at the 0.382
For three sessions the daily candles had been probing the underside of the 0.382 Fibonacci level near $76,066, a line that held as support through the October range and flipped into resistance once it broke. Each wick was turned back without a close above it.
Tuesday’s candle opened at $75,368, reached an intraday high of $75,442, then sold off to $73,525 before stabilising. At $73,904 the pair is down $1,465, or 1.94%, on the day, and the move has carried price out of the band that contained last week’s pullback.
Where the drop stopped
The intraday low came $333 above the rising purple 200-day simple moving average at $73,191. Directly beneath it, only $630 lower, sits the horizontal 0.500 Fibonacci midpoint around $72,561. Together they form a floor the daily chart has not tested since the September breakout lifted price out of the $64,000 to $69,000 base.
Momentum arrived there already stretched. The daily RSI (14) reads 34.24, under its 38.46 signal line and approaching the 30 threshold that marks oversold territory. Volume on the session was 7.22K BTC, in line with recent days rather than the kind of spike that usually marks a capitulation low.
Distance from $73,904
50-day SMA, $81,451+10.2% 0.236 Fib, near $80,403+8.8% 100-day SMA, $77,575+5.0% 0.382 Fib, near $76,066+2.9% 200-day SMA, $73,191−1.0% 0.500 Fib, around $72,561−1.8% 0.618 Fib, close to $69,056−6.6%
The ceiling has moved down
Any recovery now has to clear two layers that were support a fortnight ago. The first is the 0.382, which has just rejected three attempts. The second is the red 100-day SMA at $77,575, which price cut through on Monday without a pause. Higher still, the yellow 50-day SMA at $81,451 is curving lower above the 0.236 Fibonacci near $80,403, so even a strong bounce would meet a falling average before it met the old range highs.
Two ways the next sessions can go
If the floor holds. A daily close that defends the 0.500 and 200-day zone, with RSI this close to oversold, sets up the conditions for a relief bounce back toward $76,066. That level is where the bounce gets graded: a close above it would put the 100-day SMA back on the map; another rejection would confirm the lower ceiling.
If the floor fails. A decisive daily close beneath $72,561 surrenders both the 200-day SMA and the macro midpoint in one move. Below that, the chart has no horizontal level until the 0.618 retracement, often called the golden pocket, close to $69,056, which also marks the top of the September breakout candle. That is a further 6.6% from Tuesday’s price, and RSI would be deep in oversold territory before it got there.
What to watch
Bitcoin has spent two months inside a range drawn by the Fibonacci levels of its summer run, and Tuesday’s drop took it to the lower half of that range rather than out of it. The next inflation reading, November’s CPI, is scheduled for December 10. Until then, the daily closes relative to $73,191 below and $76,066 above decide whether this was a dip to support or the start of a deeper retracement.
This story was originally published by Coindoo. Read the original article.