Bitcoin Crash Coming? Analyst Revisits 2014, 2018, and 2022 Pattern Ahead Of Midterm Elections

Bitcoin (BTC) could face another significant correction as the November 3 U.S. midterm elections approach, with analysts pointing to a historical pattern that has coincided with major BTC price declines during previous election cycles.
With the 2026 midterm elections just days away, market observers are examining Bitcoin’s performance around the 2014, 2018, and 2022 elections to see whether another downturn is approaching.
Although the historical similarities do not establish that elections directly influence cryptocurrency prices, the repeated appearance of major corrections during these periods has raised questions about Bitcoin’s near-term direction.
According to crypto analytics platform Alphractal, Bitcoin was already experiencing bearish conditions before each of the previous three midterm elections. However, selling pressure continued after Election Day, with the cryptocurrency eventually reaching significant cycle lows.
Looking back at the 2014 U.S. midterm elections held on November 4, Bitcoin was already caught in an extended bear market. The cryptocurrency continued declining in the weeks that followed, eventually reaching its cycle bottom in January 2015.
A similar development occurred in 2018. Bitcoin was trading around $6,400 when Americans headed to the polls on November 6. Although the market initially experienced a period of relative stability, BTC subsequently suffered a sharp decline, losing approximately 40% over the following month before establishing its cycle bottom in December.
Meanwhile, during the 2022 election cycle, Bitcoin had already experienced considerable losses by the time the November 8 elections took place. The collapse of cryptocurrency exchange FTX occurred around the same period, triggering another wave of selling that pushed BTC toward $15,500 and marked the bottom of that market cycle.
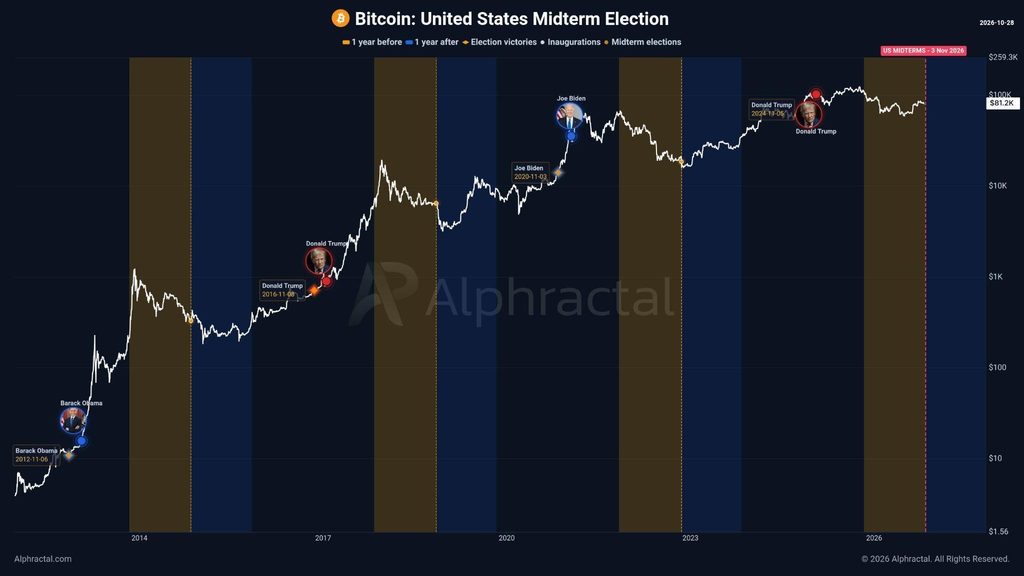
According to Alphractal, these three occurrences raise an interesting question about whether Bitcoin’s performance has any meaningful relationship with the U.S. electoral calendar.
The analytics platform emphasized that Bitcoin was already in a bear market ahead of all three elections. Consequently, the subsequent declines could have reflected broader cryptocurrency market conditions and the asset’s four-year cycle rather than the elections themselves.
Additionally, popular analyst Ali Martinez highlighted Bitcoin’s historical performance across four U.S. midterm election cycles.
According to Martinez, BTC recorded significant declines around the 2010, 2014, 2018, and 2022 midterm elections, with reported losses of 72%, 65%, 52%, and 27%, respectively.
The analyst considers this repeated downside performance a pattern worth monitoring as another election approaches on November 3.
Furthermore, Martinez pointed to Bitcoin’s fourth-quarter returns during previous midterm election years. His figures show that BTC gained 391% in the fourth quarter of 2010, while the cryptocurrency recorded losses of 16.70% in 2014, 42.16% in 2018, and 14.75% in 2022.
The figures suggest that three of the four election-year fourth quarters ended negatively. However, the 2010 rally stands out as an exception, particularly because Bitcoin was still in its early stages of development.

For the upcoming election, Martinez identified $73,000 as an important price level to watch. He pointed to Bitcoin’s short-term holder cost basis, which represents the average acquisition price of coins held by relatively recent market participants.
According to his assessment, this level could become an important support area if selling pressure increases following the elections. A recovery from that region would potentially strengthen the bullish outlook, while continued weakness could signal further deterioration in market conditions.
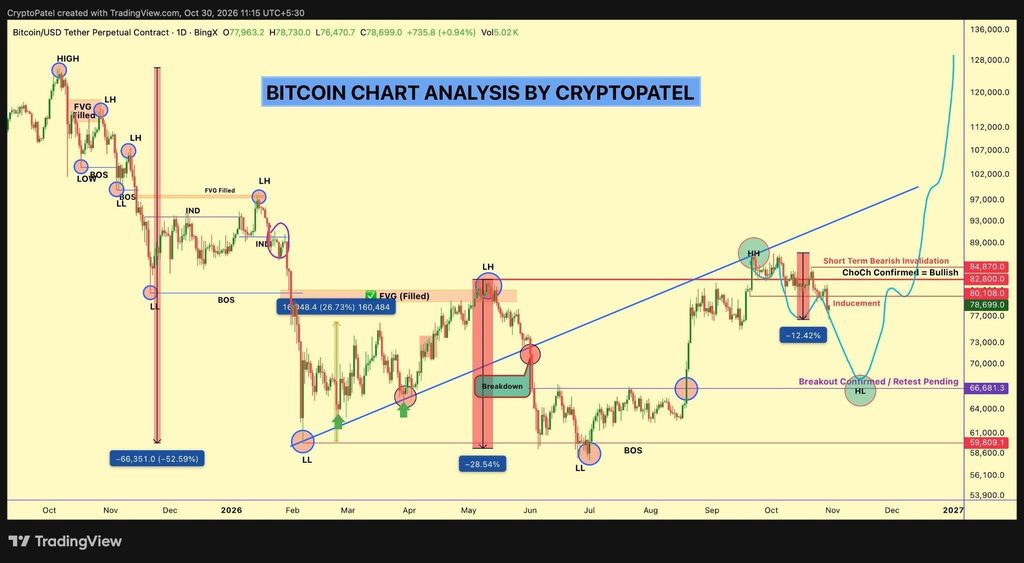
Beyond the historical election pattern, technical analyst Crypto Patel has also raised concerns about Bitcoin’s immediate price direction, suggesting another substantial decline is possible.
In a recent market update, the pundit said Bitcoin had already fallen about 12% from his previously identified short-entry area. He explained that his bearish outlook originated from technical chart analysis rather than negative headlines or developments affecting the cryptocurrency industry.
The analyst based his assessment on Smart Money Concepts (SMC), which examines market structure, liquidity movements, and price action to identify potential trading opportunities.
Notably, Patel explained that Bitcoin’s price structure had produced a higher high, leading him to anticipate a subsequent move toward a higher low. He also highlighted the removal of inducement liquidity and a higher-timeframe candle closing below the relevant inducement level as additional bearish signals.
Regarding his latest projections, he identified $66,000 to $62,000 as his potential downside target, provided Bitcoin remains below $81,950.
However, the analyst also established a level that would invalidate his short-term bearish outlook. According to Patel, a higher-timeframe candle closing above $84,870 would prompt him to reconsider his position and return to a bullish stance, with expectations of a move beyond $100,000.
These projections suggest that Bitcoin could experience additional volatility as traders assess the market’s technical structure alongside the approaching U.S. elections.
At press time, BTC was trading at $71,454, down 3.92% over the past 24 hours.
This story was originally published by ZyCrypto. Read the original article.